Services
Scheduled Tasks
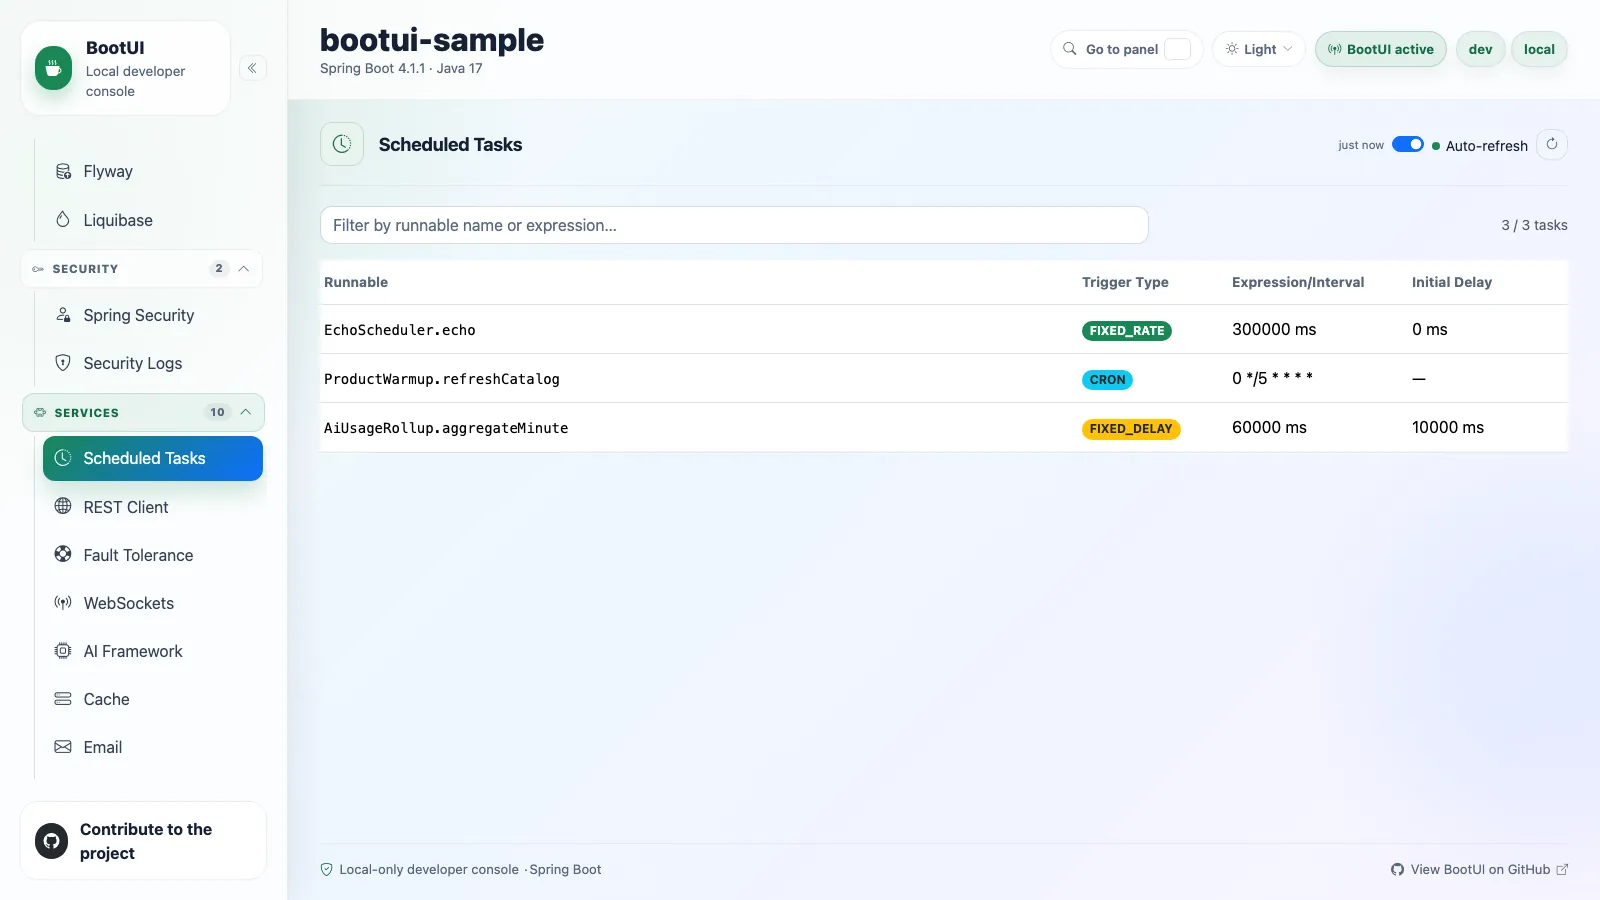
The Scheduled Tasks panel lists the jobs registered with Spring's scheduling infrastructure, with their task type and trigger metadata, so background activity is visible during local development.
Quarkus serves the same /bootui/api/scheduled contract from @Scheduled methods captured at build time. Only annotation-discovered tasks are captured there.
Quarkus capture and worker correlation
The runtime io.quarkus.scheduler.Scheduler exposes only trigger ids and next-fire times, so the Quarkus adapter reads every @Scheduled method from the Jandex index at build time. A cron member becomes a CRON row, an every member a FIXED_RATE row, and an initial delay is carried through. The panel needs the quarkus-scheduler extension; programmatic Scheduler.newJob() jobs are not captured.
Scheduled observations restore the worker's previous correlation when their scopes close, so a completed job's execution id is never left on a pooled worker to attribute unrelated later work.
REST Client
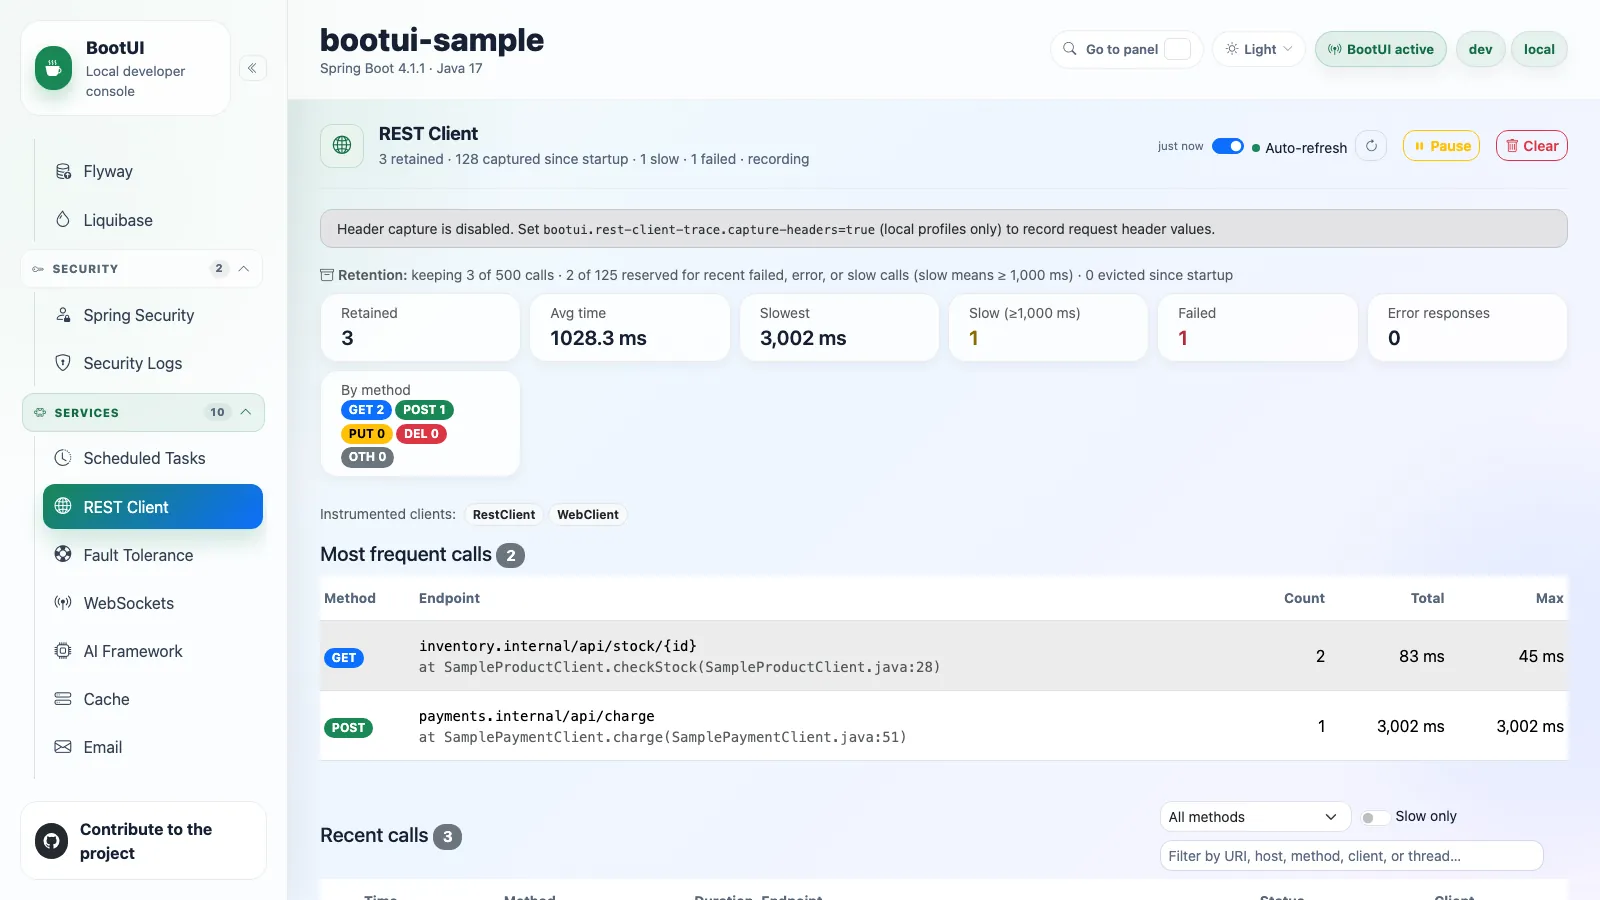
The REST Client panel shows the outbound HTTP calls your application recently made, through Spring's RestClient, RestTemplate, and WebClient, or Quarkus REST Client Reactive proxies. A capture failure never disrupts the call.
Each call records its method, host, path, sanitized query string, response status, duration, success or failure, client type, trace id, executing thread, and, with call-site capture enabled, the call site in your own code.
Reading the panel
Calls are kept in a bounded, most-recent-first buffer with aggregate stats: retained count, average and slowest duration, and slow-call count. A share of the buffer, 25% by default (bootui.rest-client-trace.reserved-share-percent), is reserved for the most recent failed, error-response, and slow calls; see Failure-preserving retention. An outbound call can fail two ways, so there are two counters:
| Counter | Counts |
|---|---|
| Failed | Transport-level failures with no response: connection refused, timeout, DNS failure. |
| Error responses | Calls that completed with a 4xx or 5xx status. |
A Most frequent calls table groups calls by method, host, and normalized path (numeric and UUID segments collapse to {id}) and flags groups at or above bootui.rest-client-trace.chatty-call-threshold as chatty, for any HTTP method. Rows filter by method, slow-only, or free text and expand to full detail. Local-only Pause, Resume, and Clear actions stop recording or empty the buffer; pausing stops only this panel's buffer, and the runtime journal keeps recording. Over MCP and the CLI, the controls answer with a compact acknowledgement.
Privacy
Spring retains the URI and masks query values by name. Quarkus is strictly metadata-only and never reads bodies, headers, or credentials. Call sites are your own code (class, method, line), never a value, so bootui.rest-client-trace.capture-call-site (default true) is not privacy-gated.
Exact redaction rules
- Spring masks query values by name with the same
SecretMaskerrules as Config and HTTP Exchanges, matched percent-decoded. URI credentials such asuser:secret@hostare removed before buffering, and the client error message is flattened, credential-redacted, and truncated. Request headers are withheld by default;bootui.rest-client-trace.capture-headers=trueopts into bounded, exposure-aware header capture. - Quarkus is always metadata-only: it ignores the header property, never reads bodies, headers, authorization, cookies, or tokens, and strips URI user-info and fragments and masks sensitive path and query values before storage. Call-site attribution is best-effort there, because a reactive callback can run after the issuing stack unwound.
Availability and streaming
The panel is available on all three stacks, and refreshes over Server-Sent Events from /bootui/api/rest-client-trace/stream. Recent calls also appear in Live Activity, nested under the request that made them, with a deep link back here. Capture, buffer size, and thresholds are configurable under bootui.rest-client-trace.*.
Interception, availability, and Quarkus wiring
| Adapter | Instrumentation | When the panel becomes available |
|---|---|---|
| Spring MVC | RestClientCustomizer and RestTemplateCustomizer hooks | Once the recorder has instrumented anything |
| Spring WebFlux | ExchangeFilterFunction on the auto-configured WebClient.Builder | After that builder has customized a client |
| Quarkus | RestClientListener SPI attaching a filter on every proxy | When quarkus-rest-client is present |
Spring customizes every auto-configured RestClient and RestTemplate with a shared interceptor, and skips a client type whose Spring Boot module is not on the classpath. Quarkus attaches a filter to every @RegisterRestClient proxy through the MicroProfile RestClientListener SPI. Both let the request through and record around it, so an instrumentation error never breaks the call.
Quarkus builds proxies lazily, so the panel stays visible and says no proxy has been initialized until the first call. A pre-response transport failure is recorded as a failed call with no invented HTTP status, while a real 4xx or 5xx stays a transport-successful error response.
Live Activity nesting uses BootUI's request id first on every stack, then the trace id and serving thread on Spring MVC, and the trace id alone on WebFlux and Quarkus. The chatty grouping is visible only in this panel.
Fault Tolerance
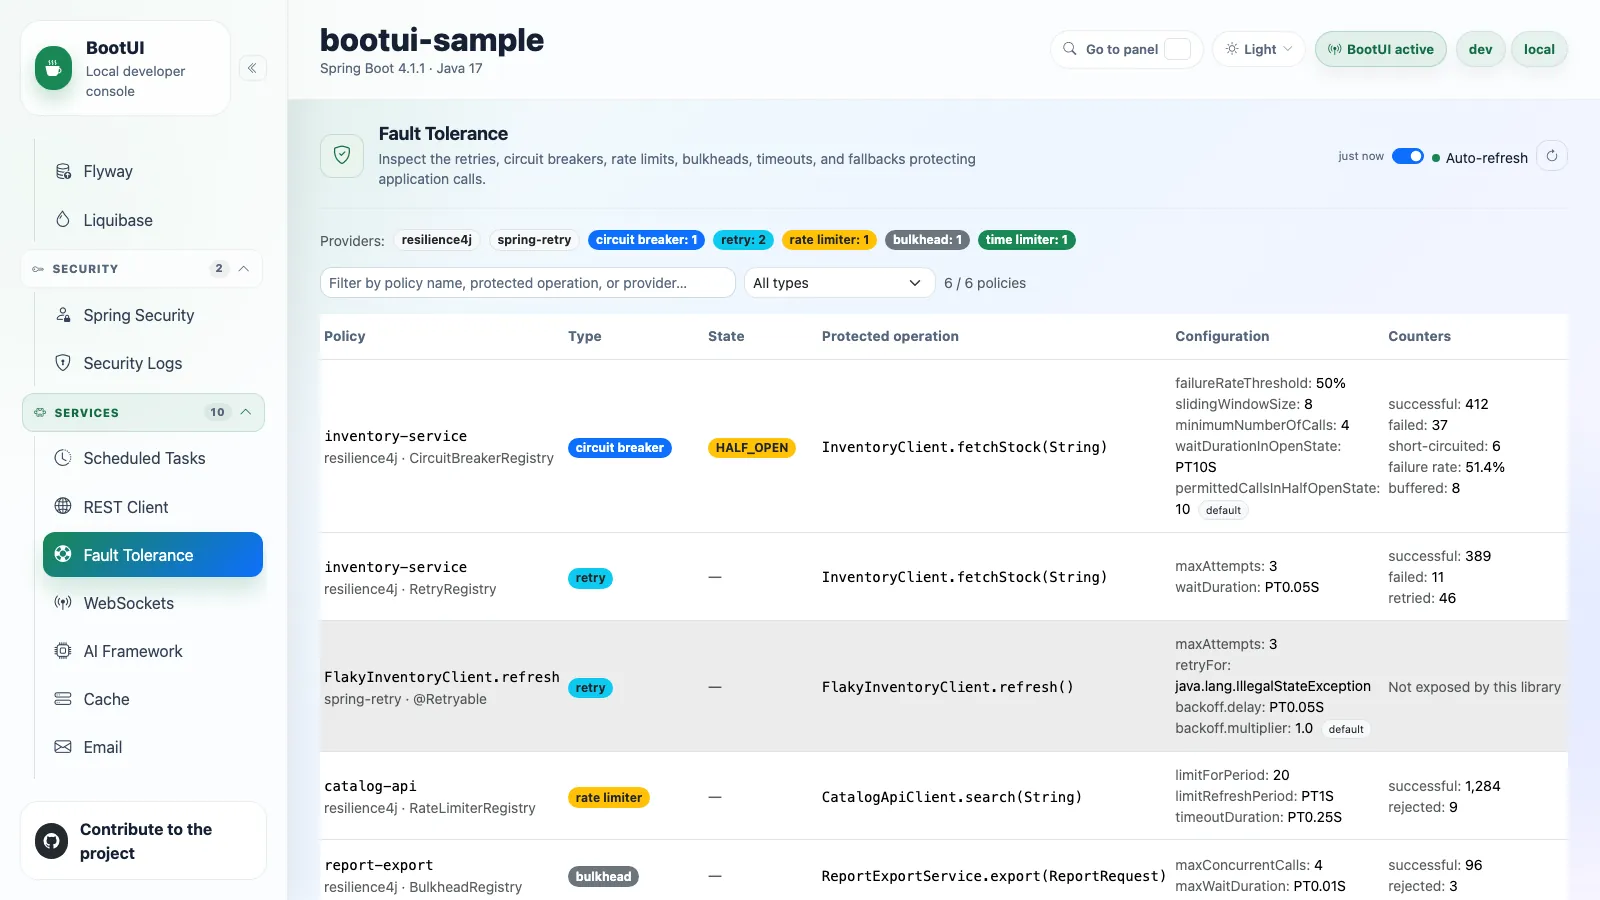
The Fault Tolerance panel makes the application's protective policies visible. It lists every circuit breaker, retry, rate limiter, bulkhead, time limiter, and fallback the application declares, with the settings that apply, the protected operation, live circuit breaker state, and call counters where the library exposes them. A bounded event feed below shows retried calls, exhausted retries, rejected calls, timeouts, short circuits, and state transitions.
Resilience4j and Spring Retry are supported on Spring MVC and WebFlux, and SmallRye Fault Tolerance on Quarkus; several can be active at once.
The panel is capture-only: BootUI never opens, closes, resets, or forces a policy, and never triggers a protected call. Events also appear in Live Activity as FAULT_TOLERANCE entries, correlated with their request, and clicking one opens this panel filtered to that policy. Set bootui.fault-tolerance.enabled=false to keep the inventory while recording no events.
Per-provider sources and capture scope
- Resilience4j reads the circuit breaker, retry, rate limiter, bulkhead, thread-pool bulkhead, and time limiter registries live, including entries created at runtime. Its own event publishers feed the event feed, with no wrapping by BootUI. A first retry delay that needs a call result to calculate is omitted rather than guessed.
- Spring Retry reads
@Retryablemetadata plus an additiveRetryListenerthat records attempts and exhaustion. - SmallRye Fault Tolerance reads
@CircuitBreaker,@Retry,@Timeout,@Bulkhead,@RateLimit, and@Fallbackfrom the Jandex index at build time, with MicroProfile configuration overrides resolved at runtime. A policy disabled through configuration is listed withenabled=false. Circuit breaker state and transitions come fromCircuitBreakerMaintenancefor breakers carrying@CircuitBreakerName; there is no per-call event stream, so retries and rejections are not individually captured.
Events are metadata only: policy name, outcome, attempt number, duration, the simple name of the exception class, and circuit breaker state. Arguments, return values, payloads, and exception messages are never recorded.
WebSockets
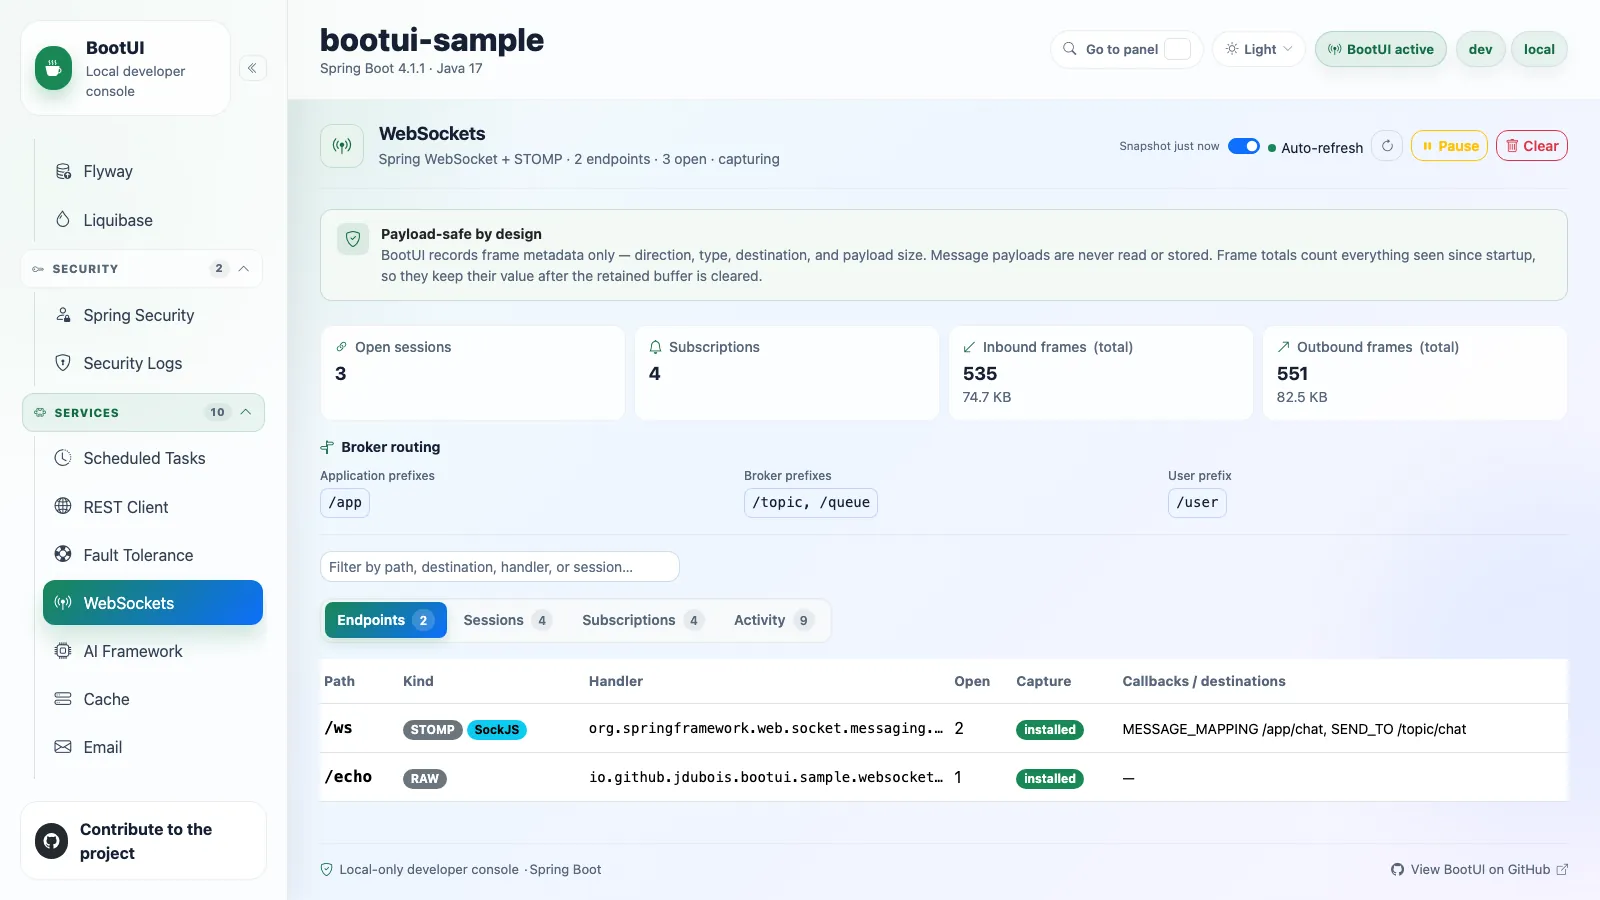
The WebSockets panel shows the endpoints your application declares, the connections open against them, the STOMP destinations those connections subscribed to, and a bounded log of recent frame metadata. It never records a message payload.
The four tabs
- Endpoints: each endpoint with its path, kind (
STOMP,HANDLER, orENDPOINT), handler, open connections, whether frame capture is installed, and the destinations and STOMP prefixes it serves. - Sessions: live connections with an opaque session id, state, frame and byte counters, and remote address.
- Subscriptions: each STOMP subscription mapped to its session and destination.
- Activity: the recent frame log, with direction, frame type, destination, payload size, and outcome.
Capture-only and metadata-only
BootUI never reads, decodes, buffers, or stores a message payload on any stack; frame size comes from the transport's own counters. Raw session ids are replaced by a salted, one-way hash and destinations are redacted. BootUI never opens, closes, or writes to a connection.
Frame capture is installed only where the framework offers a sanctioned seam: Spring MVC with @EnableWebSocketMessageBroker. Spring WebFlux reports endpoint topology, and Quarkus reports endpoints and live connections, but neither supports frame capture; the panel shows the reason. Local-only Pause/Resume and Clear actions honor bootui.panels.websockets.read-only. Capture and caps are configurable under bootui.websockets.*.
Per-stack capture, journal, and gating
On Spring MVC, BootUI registers a WebSocketHandlerDecoratorFactory and ChannelInterceptors through the public WebSocketMessageBrokerConfigurer contract, so STOMP endpoints are badged installed. Native WebSocketHandler endpoints without the broker report topology and are badged metadata. On WebFlux, @EnableWebSocketMessageBroker is servlet-only; on Quarkus, WebSockets Next has no message-interception SPI. Spring MVC and Quarkus observe connection lifecycle; WebFlux has no session registry, so its Sessions table says so (sessionTrackingSupported).
Separately, each inbound application message is an execution in the runtime journal on all three stacks: the SQL, exceptions, and calls its handler makes nest under a WEBSOCKET row in Live Activity, and a completed handler can be opened in a journal-backed profile. That covers the @MessageMapping or @SubscribeMapping method on Spring MVC, the synchronous work of a WebSocketHandler on WebFlux, and each @OnTextMessage or @OnBinaryMessage call on Quarkus. bootui.websockets.enabled=false turns it off.
Spring gates the panel on spring-websocket and spring-messaging. Quarkus gates it on quarkus-websockets-next and at least one @WebSocket endpoint, captured from the Jandex index.
AI Framework
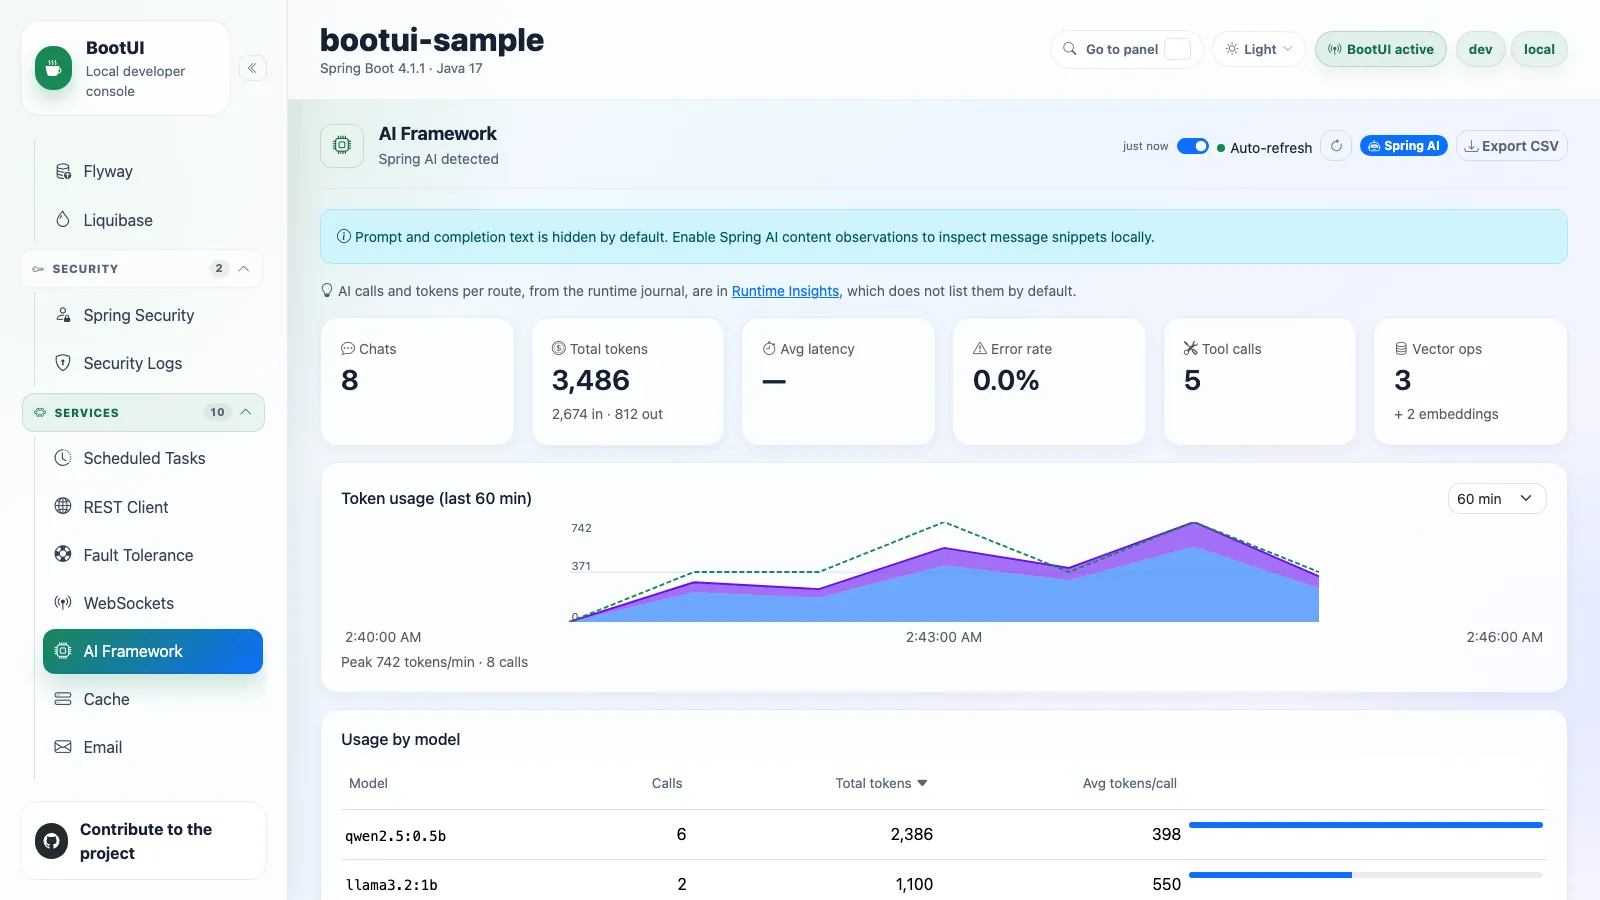
The AI Framework panel summarizes Spring AI and LangChain4j activity from the OpenTelemetry spans their observability emits. It groups chat client and chat model spans by conversation, showing request count, token usage, latency, model, and the prompt and response snippet when content capture is configured. An inline chart shows token usage over recent calls, and vector store and embedding spans appear alongside. Data lives in memory only.
AI calls and tokens per route are in Runtime Insights (ai-usage-by-route); this panel links to them, and the link opens Runtime Insights with every row shown.
The sidebar dims the panel when telemetry is disabled or neither framework is on the classpath, and the view shows a setup checklist. On Quarkus the panel is identical and needs quarkus-opentelemetry.
Setup and content capture
Recent chats, token windows, spans, and attributes are bounded. With no framework detected, the checklist shows a Spring AI guide and a LangChain4j guide; on Quarkus it shows a single quarkus-langchain4j plus quarkus-opentelemetry guide with no embedded OTLP receiver. When prerequisites are ready but no chat spans have arrived, the panel shows a ready empty state.
Prompt and response snippets appear only when the framework captures content. For Spring AI, set spring.ai.chat.client.observations.log-prompt, spring.ai.chat.observations.log-prompt, and spring.ai.chat.observations.log-completion. For LangChain4j, enable GenAI message-content capture on the OpenTelemetry instrumentation.
AI Framework value exposure
The chat detail (GET /bootui/api/ai/chats/{spanId}) applies the live bootui.expose-values and bootui.mask-secrets policy on every read, using the trace value exposure rule. Under the default MASKED, prompts, completions, and exception text have secret-like assignments and credentials masked. Under METADATA_ONLY, that text is omitted. Only FULL shows it verbatim. Token counts, models, finish reasons, and timings are never masked.
Cache
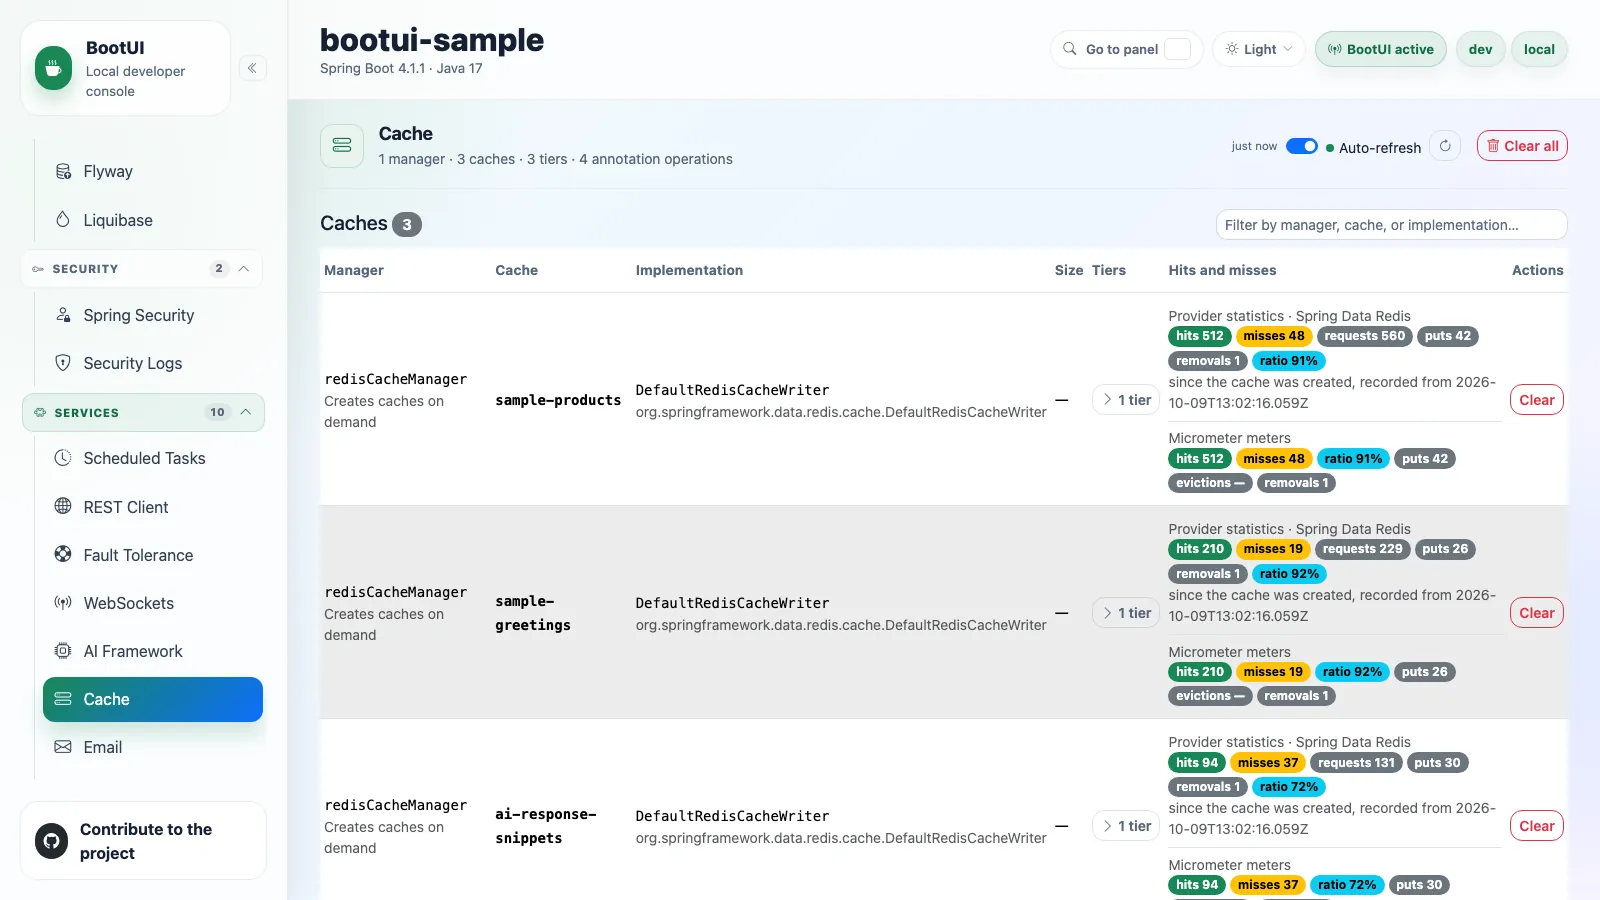
The Cache panel inspects the application's cache infrastructure through one shared contract: Spring's cache abstraction on Spring Boot, and quarkus-cache on Quarkus.
On Spring Boot it lists cache managers, caches, safe local sizes, Micrometer cache metrics when registered, and the discovered @Cacheable, @CachePut, and @CacheEvict operations. Clear actions need explicit confirmation; disable them with bootui.cache.clear-enabled=false.
Tiering and hit ratios
Each row discloses the backing tiers the cache describes through its own public API, and the native counters it records. BootUI never fabricates a value: an unavailable counter is omitted rather than shown as zero, and reading tiers never contacts anything over the network.
What a tier carries and how honesty is preserved
A tier carries its level (L0 is consulted first), implementation type, locality (this JVM or remote), configured maximum entries, and configured expiry, plus a short policy note when a bare number would mislead (a weight-bounded Caffeine cache states its bound is a total weight).
- A cache that does not describe its storage is marked Not described with a reason; no tier is inferred.
- Caffeine without
recordStats()and Spring Data Redis withoutenableStatistics()report unavailable with the fix, not an all-zero series. - A hit ratio is derived only from a hit and a miss counter the adapter declared comparable, when their sum is positive. An idle cache shows ratio unknown, never "0%".
- No Redis entry count is reported, because counting keys would be a network round trip. The Quarkus adapter reads a Caffeine cache's entry count through
keySet(), which copies the key set, so a very large cache pays a local cost when opened. - Topologies are bounded (100 managers, 500 caches per manager, 20 tiers per cache), and truncation is stated in the report's warnings.
For example, a RedisCache shows a remote tier with its time-to-live and, once spring.cache.redis.enable-statistics=true, the locally recorded gets, hits, misses, puts, and deletes. A spring.cache.type=simple cache shows one local map tier and reports that it records nothing.
On Quarkus
The same panel is served over quarkus-cache, reading the topology from the application's CacheManager and overlaying Micrometer metrics when a quarkus-micrometer registry is present. Clear uses cache.invalidateAll(). Tier metadata is one local Caffeine tier per cache, with limits from quarkus.cache.caffeine."<name>".*. Quarkus's public CaffeineCache exposes no statistics accessor, so hit and miss counters are unavailable and the panel points at Micrometer. Because @CacheResult and related annotations are woven at build time, there is no runtime registry of cached operations, so the operations table is replaced by a note. The panel is unavailable without quarkus-cache.
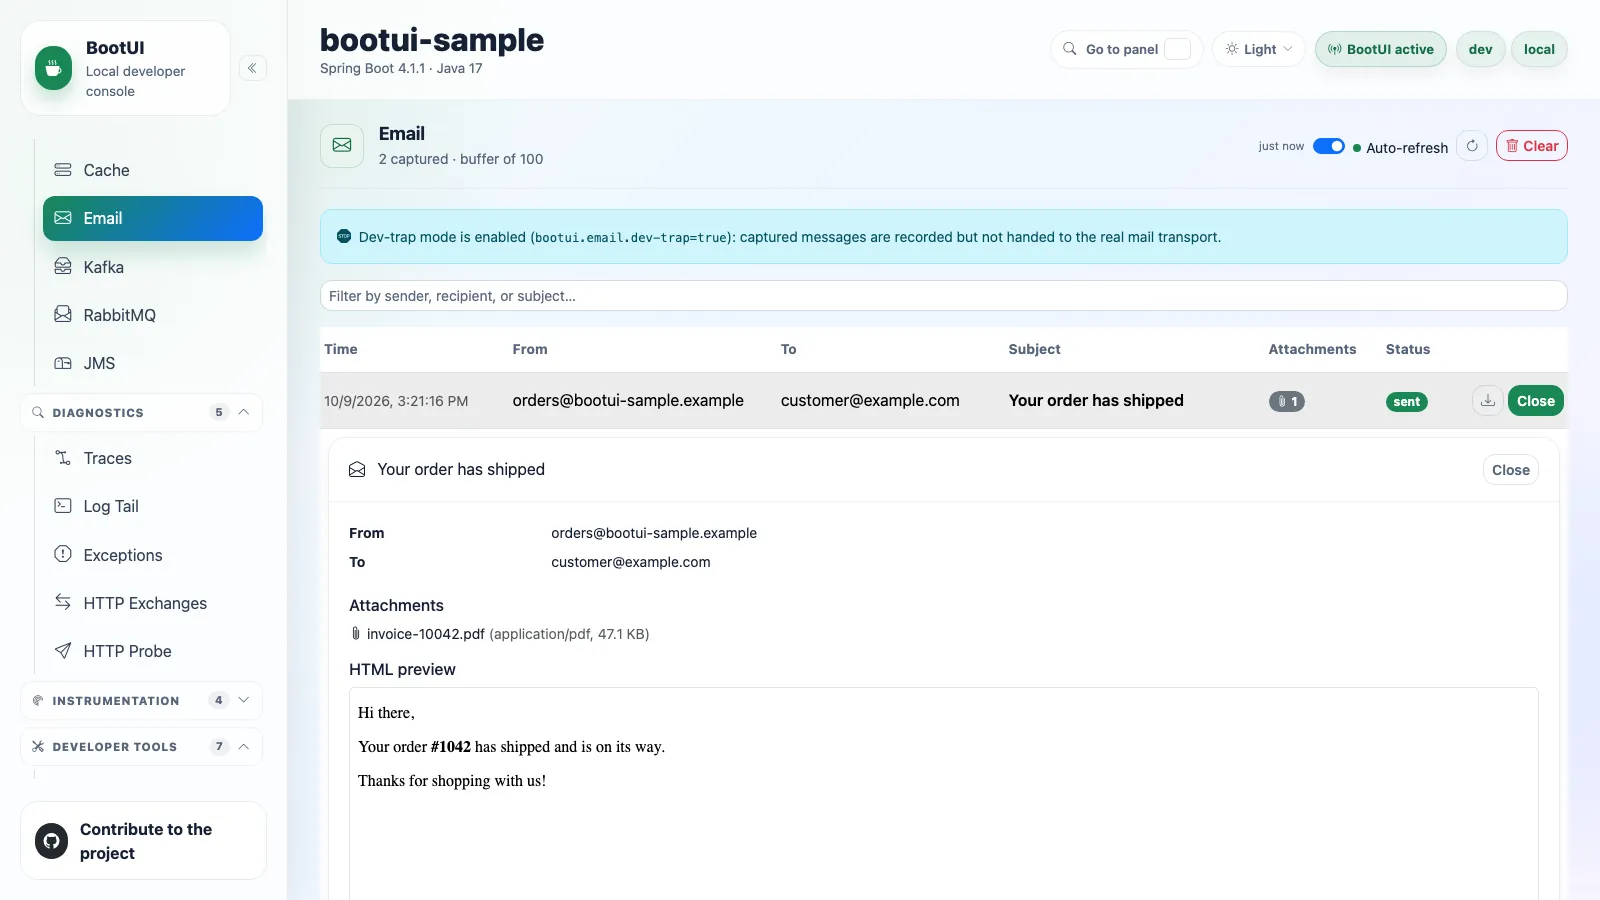
The Email panel captures outgoing application mail. It intercepts the application's JavaMailSender so every send(...) call is recorded into a bounded buffer before delegating to the real sender, so application behaviour is unchanged.
Messages are listed newest first. Opening one shows the parsed addresses, a sandboxed HTML preview, the plain-text alternative, and attachment metadata (never contents). Each message downloads as an .eml file.
Recipients, subjects, and bodies are revealed by default, consistent with HTTP Exchanges and SQL Trace. Opt into masking with bootui.email.mask-content=true. The opt-in bootui.email.dev-trap=true records messages without sending them; it is off by default, so BootUI never silently swallows mail. The panel needs a JavaMailSender bean, for example from spring-boot-starter-mail, and otherwise reports an unavailable reason.
Masking, preview, and truncation
The HTML preview renders in a sandboxed iframe with scripts and same-origin access disabled. Email content is not a config secret, so the global bootui.expose-values flag does not mask it. bootui.email.mask-content=true reuses the name-based SecretMasker heuristic and is lifted only under bootui.expose-values=FULL. Each body is truncated at bootui.email.max-body-length characters (default 200,000) before the bootui.email.max-entries cap evicts entries. Attachment content is never captured.
On Quarkus
The panel is identical over /bootui/api/email and available when quarkus-mailer is on the classpath. Quarkus fires its capture event after the send, so the recorded-but-not-sent state reflects Quarkus's mock-mail mode (quarkus.mailer.mock=true, the default in dev and test), and such messages are labelled mock instead of dev-trap. One @Observes SentMail observer captures every send style. Attachment sizes are unknown there.
Kafka
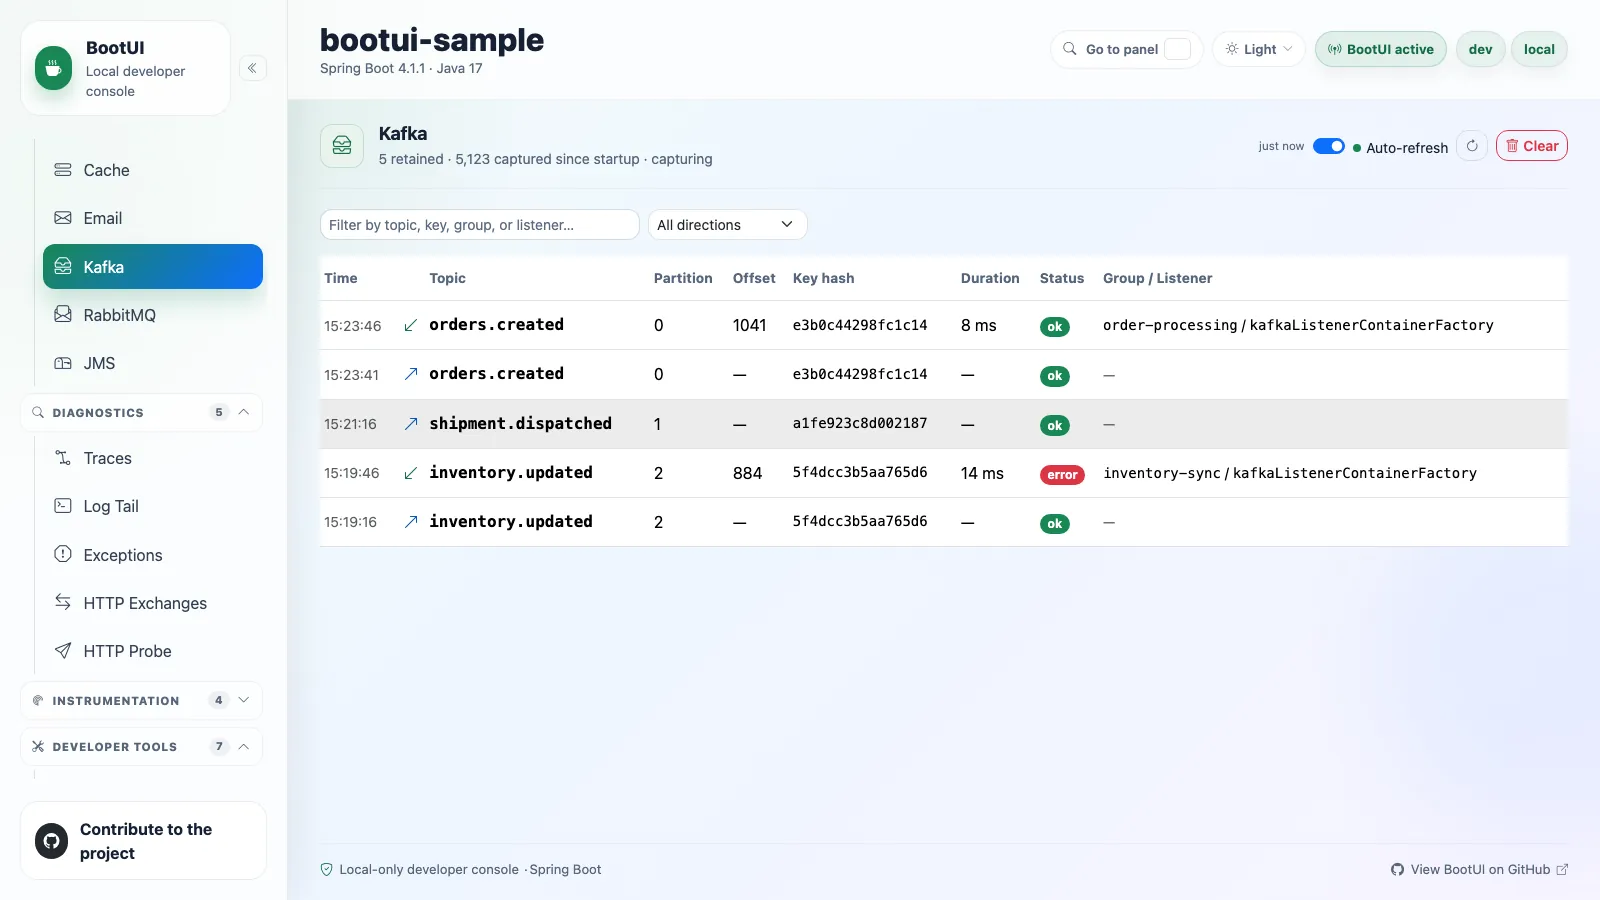
The Kafka panel is a filterable view over the producer and consumer capture that also feeds MESSAGING entries into Live Activity. Every application-owned KafkaTemplate send and @KafkaListener consume is recorded into a bounded buffer, newest first, without altering delivery.
Each row shows the direction, topic, partition, offset, a short hash of the key, processing duration, outcome, and for consumes the group id and listener. Message values and raw exception messages are never captured.
Filter by topic, key, group, listener, or direction, and clear the buffer. The panel needs a KafkaTemplate bean, for example from spring-boot-starter-kafka, and otherwise reports an unavailable reason. On Quarkus the same contract runs over SmallRye Reactive Messaging with reduced metadata: the listener identifier is the channel name, and the group id and producer duration are unavailable. It needs quarkus-messaging-kafka in a non-production launch.
Configuration and Quarkus specifics
Capture is on whenever a Kafka integration is present and the panel is enabled, tuned through the bootui.kafka.* properties shared with Live Activity (enabled, capture-key, max-entries, max-key-length); see docs/PROPERTIES.md. A produced record's offset and a send's duration are not known at send time. Turning off key capture or capture entirely shows a notice, and already-captured messages stay visible.
On Quarkus, incoming deliveries carry connector metadata automatically, while outgoing messages are captured only when they already carry OutgoingKafkaRecordMetadata.
RabbitMQ
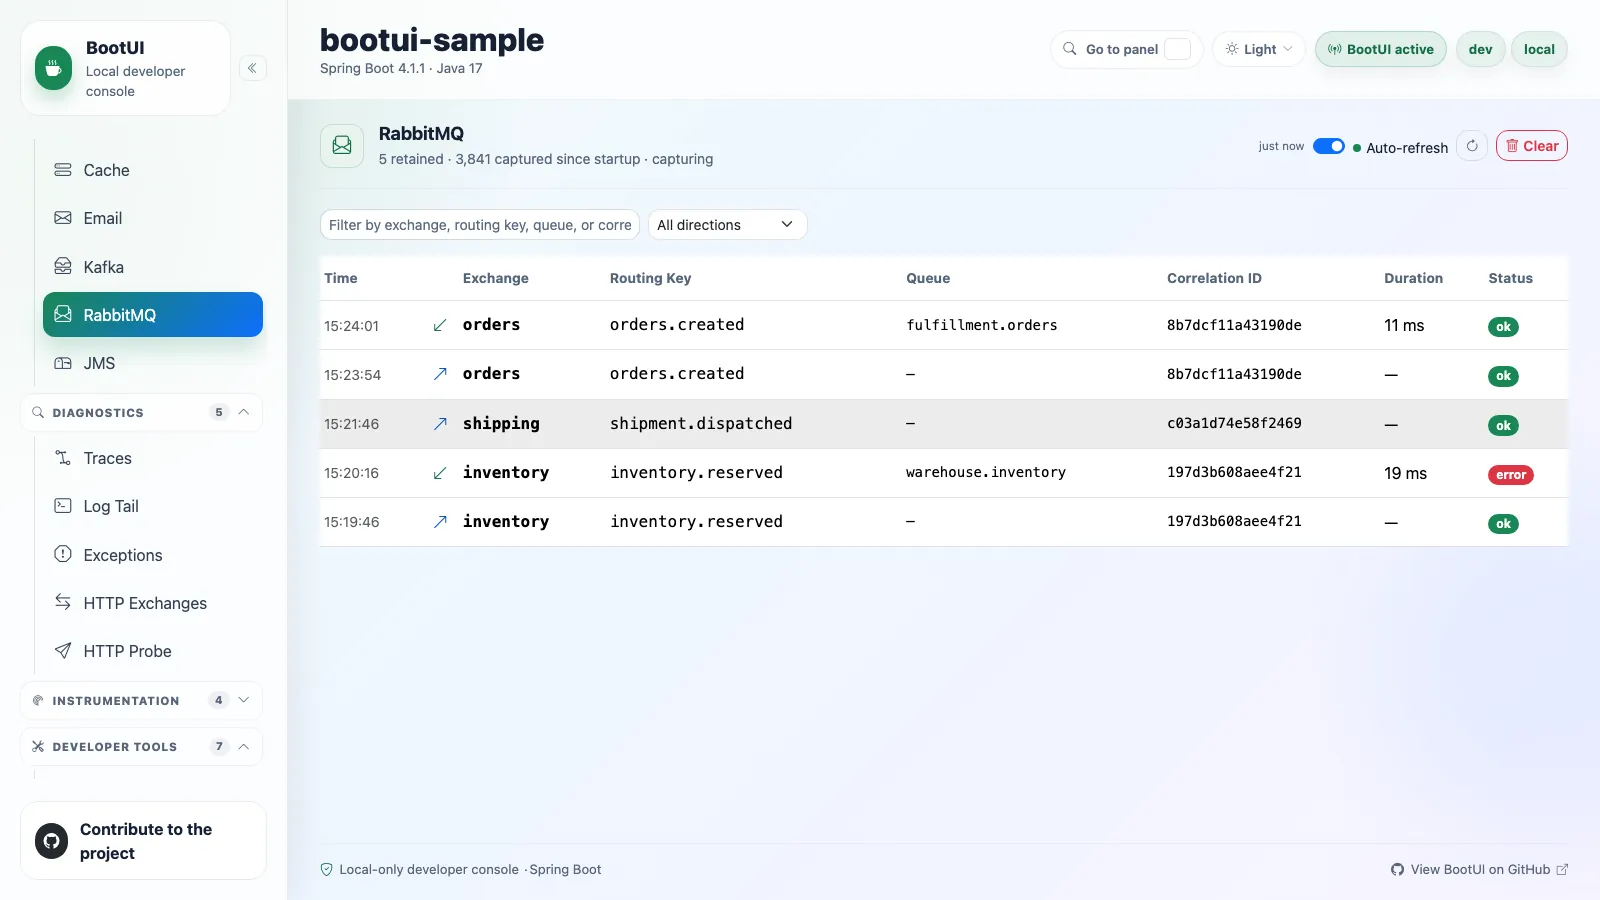
The RabbitMQ panel is a filterable view over the AMQP publish and consume capture that also feeds MESSAGING entries into Live Activity.
Each row shows the direction (PUBLISH or CONSUME), exchange, routing key, queue, processing duration, and outcome. With bootui.rabbitmq.capture-correlation-id enabled (default false), a truncated SHA-256 hash of the correlation ID is shown too. Message bodies and arbitrary headers are never captured, and failure text is generic so an exception cannot leak payload or credentials.
Capture is tuned under bootui.rabbitmq.*. The panel needs a RabbitTemplate bean, for example from spring-boot-starter-amqp, and otherwise reports an unavailable reason. On Quarkus the same contract runs over SmallRye Reactive Messaging with no producer exchange, consumer queue, or producer duration, while the routing key, outcome, and correlation-ID hash remain. It needs quarkus-messaging-rabbitmq in a non-production launch.
How interception works
On Spring, BootUI adds a MessagePostProcessor to every RabbitTemplate through addBeforePublishPostProcessors and prepends a MethodInterceptor to every listener container factory's advice chain, composing with existing ones. Spring publishes represent a publish attempt; Quarkus acks and nacks and both consumer paths represent terminal outcomes. On Quarkus, outgoing messages are captured only when they already carry OutgoingRabbitMQMetadata. The properties are bootui.rabbitmq.enabled, capture-correlation-id, max-entries, and max-correlation-id-length.
JMS
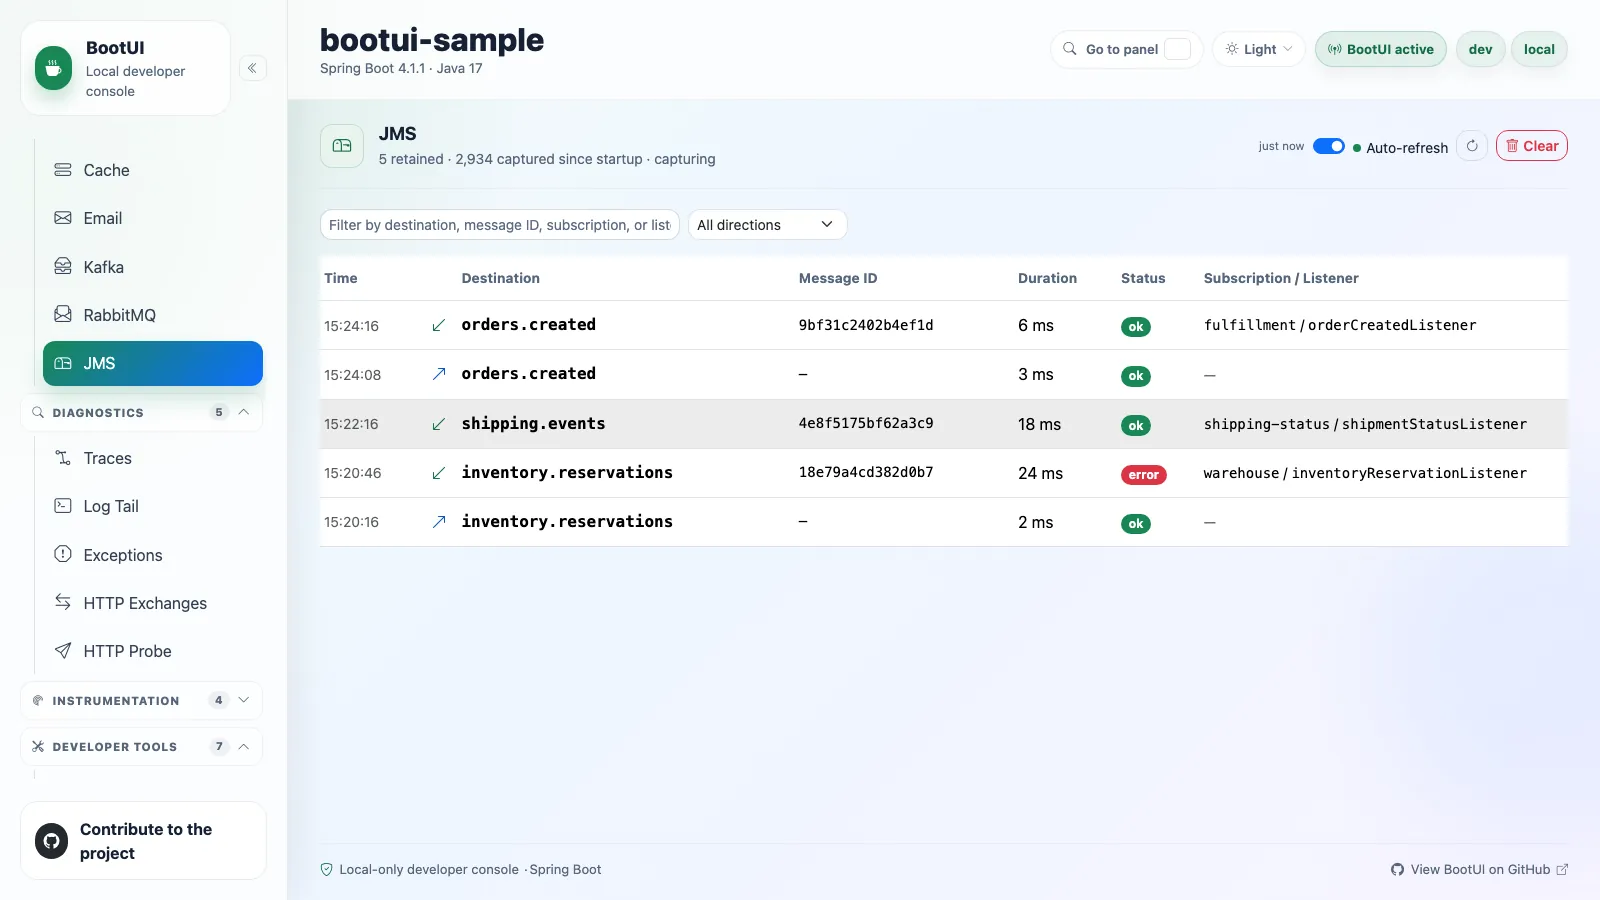
The JMS panel is a filterable view over the Spring JMS producer and consumer capture that also feeds MESSAGING entries into Live Activity.
Rows show the direction, sanitized destination, processing duration, outcome, subscription and listener, and, when enabled, a SHA-256 hash of the message ID. Payloads, headers, raw message IDs, and exception messages are never captured.
Filter by destination, message-ID hash, subscription, listener, or failure type, narrow to produced or consumed, and reset the buffer with the confirmation-gated clear action. The panel needs a JmsTemplate bean and otherwise stays visible with an unavailable reason. JMS capture is Spring-only: on Quarkus the route reports the panel as not yet available and points at the Kafka and RabbitMQ panels.
Configuration and native-image support
The panel shares JmsActivityRecorder with Live Activity, so clearing it also clears retained JMS entries from the merged feed. bootui.jms.enabled, capture-message-id, max-entries, and max-message-id-length configure both surfaces. The Spring interception uses runtime class proxies, so the panel reports unavailable in a GraalVM native image.