BootUI feature details
BootUI panels are documented here in the same grouped order as the application menu. When a panel's backing infrastructure is missing, the sidebar moves non-overview panels into the collapsed Disabled / unavailable group so you can tell at a glance which panels have no live data for the current application. Opening a dimmed panel also shows the unavailable reason at the top of the page.
Every visible panel can be hidden with bootui.panels.<panel-id>.enabled=false. Panels with browser-triggered actions also support bootui.panels.<panel-id>.read-only=true, and bootui.read-only=true makes the whole BootUI application read-only. The complete list is in the property reference.
Any action that changes server state — restarting a dev service, deleting or capturing a heap dump, writing GraalVM or CRaC artifacts into your project, running a Flyway/Liquibase migration, clearing a cache or trace buffer, or destroying an HTTP session — first opens a branded confirmation dialog that names the affected resource and flags irreversible operations. The dialog defaults focus to Cancel, dismisses on Escape or a backdrop click, and honors prefers-reduced-motion. Read-only scans and reversible toggles never prompt.
Monitoring-oriented panels hide BootUI's own runtime data by default so Beans, Conditions, Mappings, Loggers, Metrics, Startup Timeline, Scheduled Tasks, Cache, Spring Security, Security Logs, and Traces stay focused on the host application. Set bootui.monitoring.exclude-self=false to include BootUI internals while debugging the console itself.
Overview
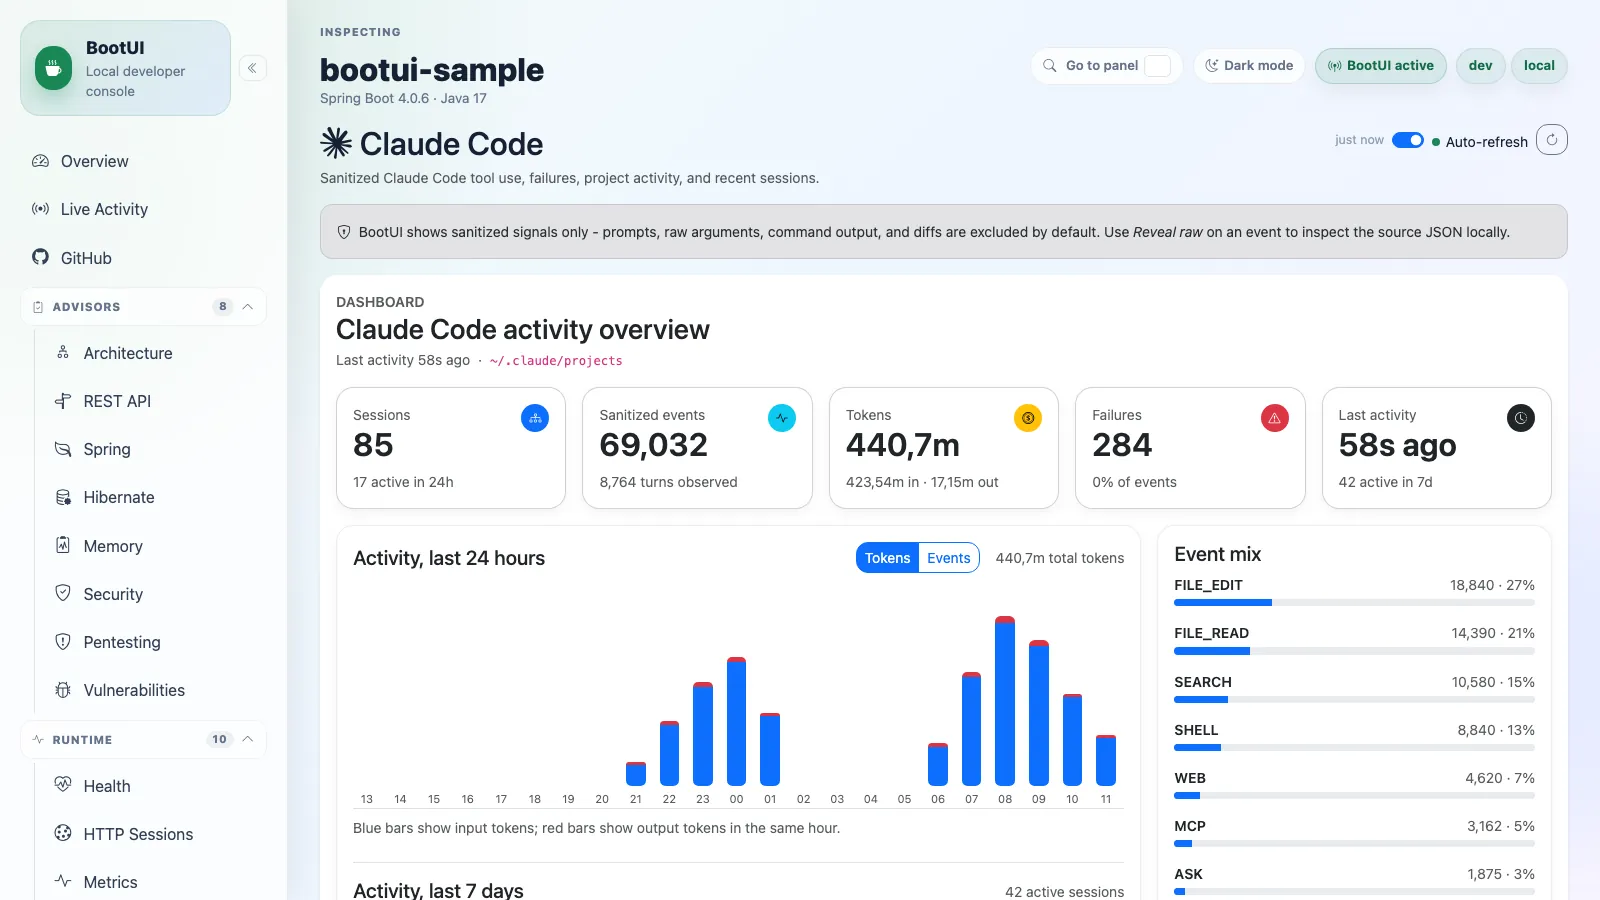
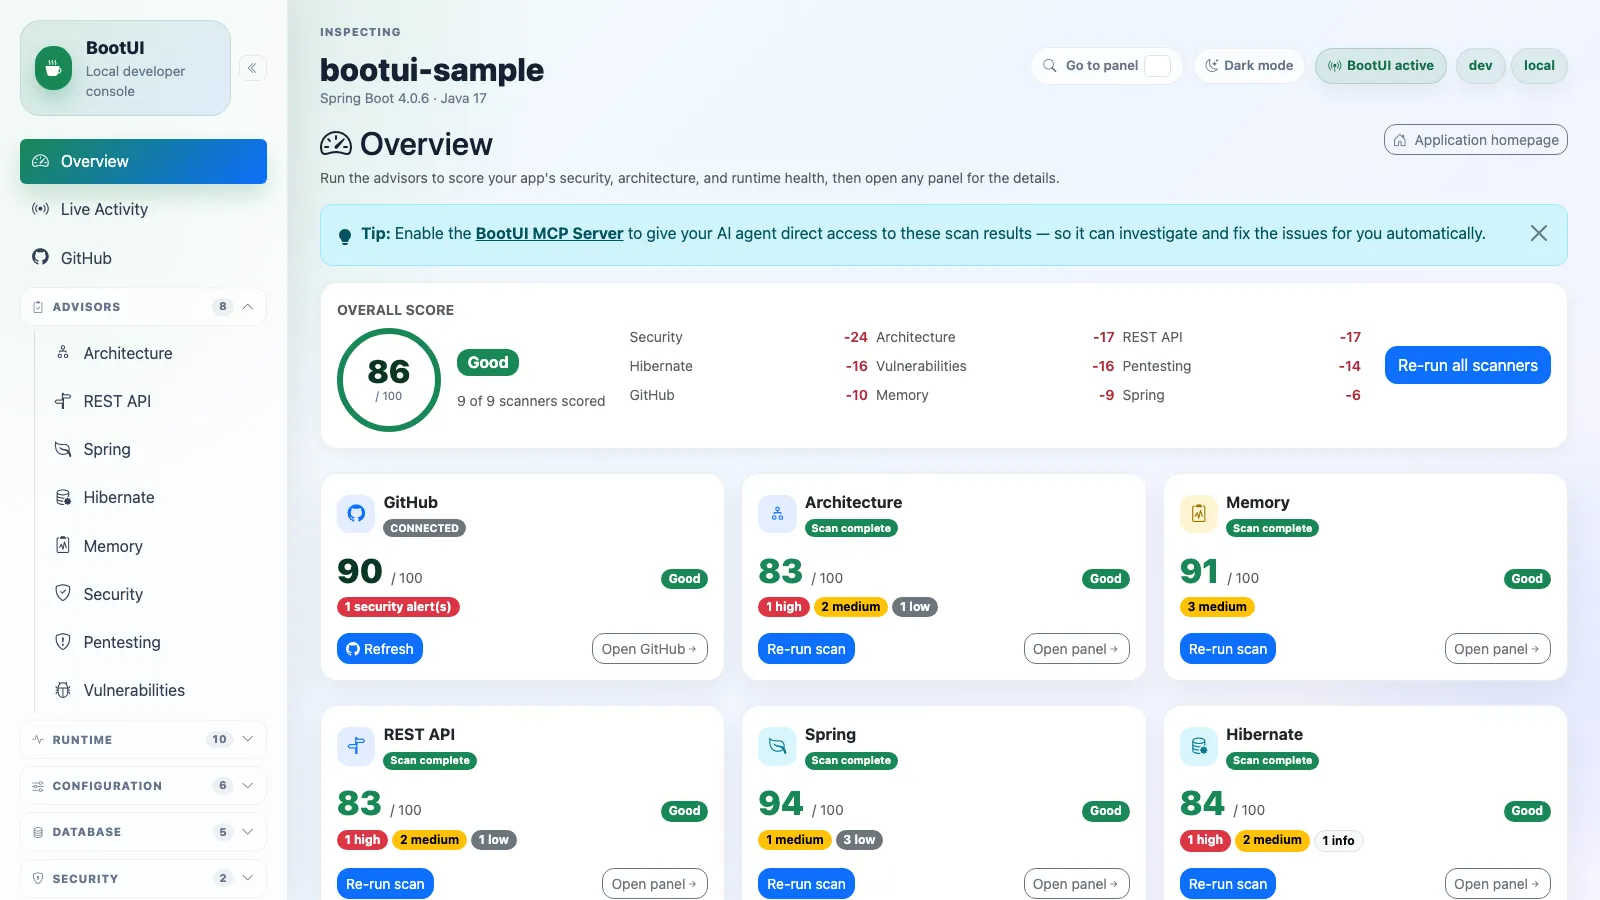
The Overview panel is the BootUI landing page and acts as a guided "understand your app in minutes" dashboard rather than a static summary. It opens with the standard panel header and a link to the running application's homepage, matching the calm, instrument-like layout of every other panel.
It is built around an on-demand security & health scoring dashboard. Before any scan has run, the overall-score card stays honest — it shows how many scanners have been scored and a prompt to run them rather than an empty gauge. Once at least one scanner has scored, an overall score out of 100 summarizes the application's posture, with a qualitative band (Good at 80+, Needs attention at 50+, At risk below 50) and a breakdown of how much each scanner deducted from a perfect score. A single "Run all scanners" button triggers every available scanner, or each scanner card can be run individually. After a run-all, a dismissible tip points to the MCP Server panel, since enabling the BootUI MCP Server lets an AI agent read these same scan results and fix the findings for you.
Each scanner card shows its own 0–100 score, status, and severity counts. The severity-based scanners are Architecture, Memory, REST API, Spring, Hibernate, Security, Pentesting, and Vulnerabilities; scores start at 100 and subtract a fixed weighted penalty per finding (critical 25, high 10, medium 3, low 1), so a clean scan stays at 100. The GitHub card is not a severity scanner: it connects to the local repository and, only when the credential is connected and authenticated, contributes a score derived from open security alerts. The overall score is the mean of the scanners that were actually scored, and only scanners whose panels are available for the current application are shown, so the dashboard degrades gracefully when optional infrastructure is missing.
On Quarkus the Overview panel is fully available. Its scoring dashboard is rendered entirely in the browser: the shell aggregates each advisor's own scan/report endpoints (only those whose panels are available on Quarkus contribute) and computes the same combined score, so no backend dashboard service is involved. The shared shell chrome around every panel — the header application name, framework and version (for example "Quarkus 3.37"), Java version, active profiles, and the active/disabled status — is populated by the same framework-neutral GET /bootui/api/overview endpoint that both adapters expose for the shell.
On Spring Boot WebFlux the Overview panel is fully available and identical in behavior — the dashboard aggregates whichever scanner panels are available on the reactive adapter (see docs/WEBFLUX-SUPPORT.md for the current per-panel list), and the shell chrome is populated by the same GET /bootui/api/overview endpoint.
Live Activity
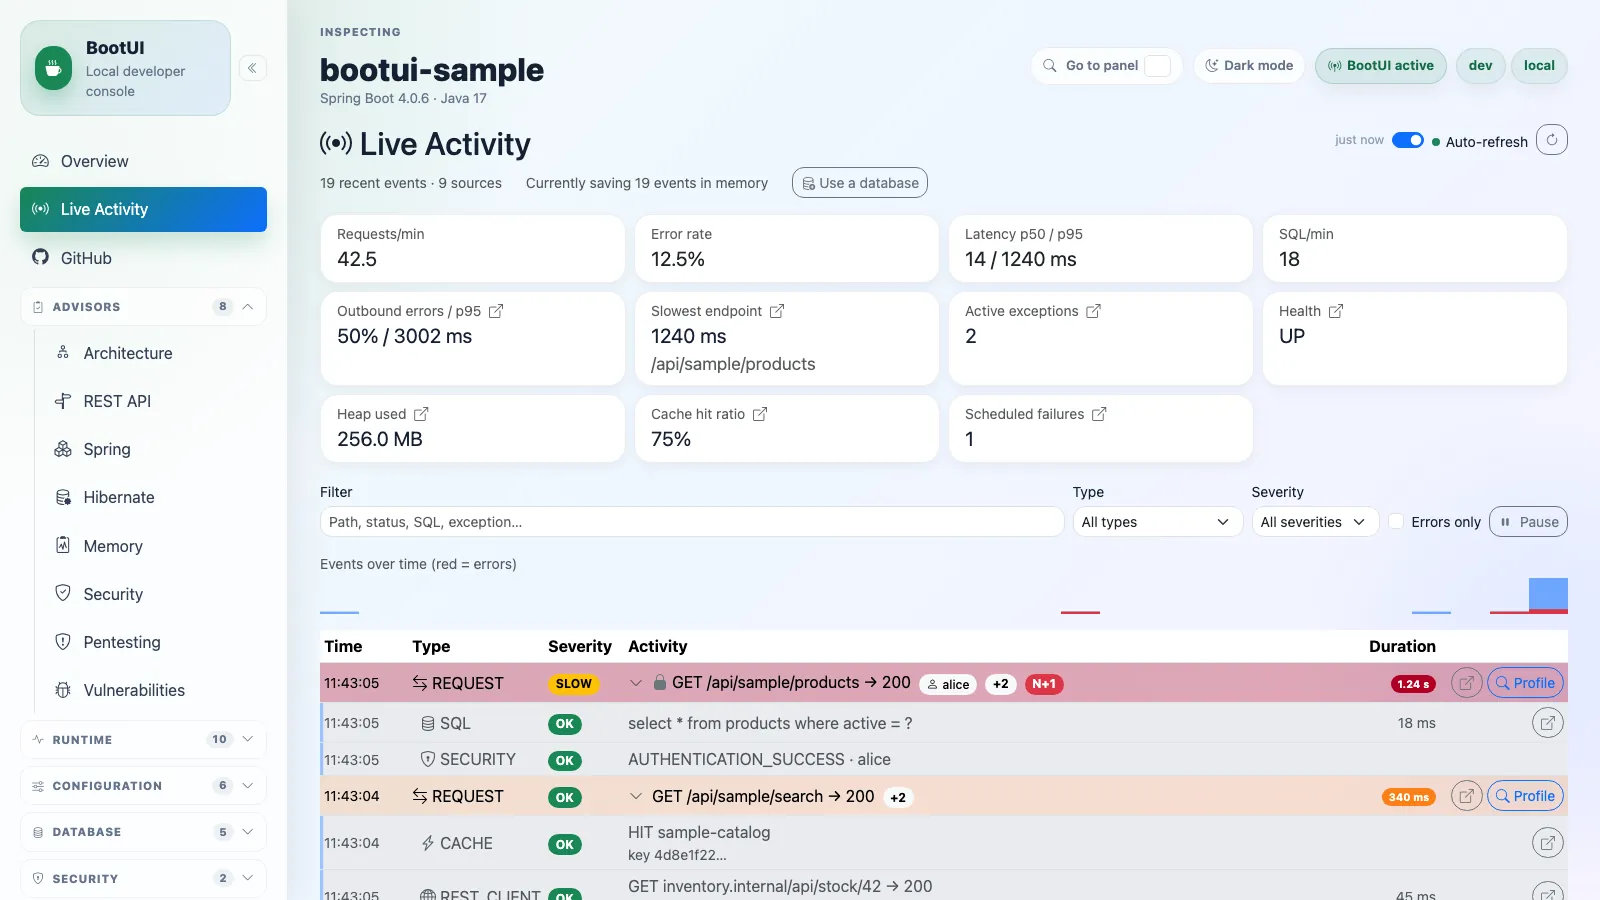
The Live Activity panel is the diagnostics "home base": a single reverse-chronological stream of everything the application just did, plus a per-request profiler for drilling into any single request. It adds no new instrumentation for six of its nine signals — instead it reuses BootUI's existing in-memory signal buffers by calling the same controllers that back the HTTP Exchanges, SQL Trace, REST Client, Exceptions, Security Logs, and Email panels, so every value is already masked, self-filtered, and bounded exactly as those panels are. The seventh signal, cache accesses, is captured by a small dedicated recorder (Spring servlet and WebFlux adapters only — see below) that only ever stores a hashed cache key, never a raw key or value. The eighth signal, scheduled-task runs, captures each @Scheduled method execution (start, success, failure, duration) on both adapters: Spring taps its own scheduling observability hook (no extra proxying), Quarkus observes the CDI SuccessfulExecution/FailedExecution events its scheduler always fires — feeding a bounded in-memory buffer the same way the other sources do. The ninth signal, Kafka producer/consumer activity, is described below.
The stream merges nine signal types into one feed: requests (REQUEST), SQL statements (SQL), exceptions (EXCEPTION), security events (SECURITY), scheduled-task runs (SCHEDULED), Kafka producer/consumer activity (MESSAGING), and captured emails (MAIL) on both adapters, plus — on the Spring servlet and WebFlux adapters only — outbound REST client calls (REST_CLIENT) and cache accesses (CACHE). Each row carries a timestamp, a type icon, a color-coded severity (OK, SLOW, WARN, ERROR), a one-line summary, and a duration where applicable; failed rows are highlighted and slow requests are tinted on a graduated yellow-to-red heat scale (crossing 100, 200, 500, and 1000 ms) with a matching latency badge so you can see at a glance how slow a request was. A request whose correlated SQL contains a suspected N+1 access pattern carries a red N+1 badge right in the row — the same detection the per-request profiler flags in detail, computed with the identical threshold/logic so the two views never disagree — so a developer scanning the feed can spot a suspect request without opening every drawer. A CACHE row summarizes the operation and cache name (e.g. "MISS orders"), with a WARN severity for a miss and OK for every other operation, and its detail shows only a short hashed key (key a1b2c3…) — the raw key or value is never captured, even under full value exposure. Adjacent identical entries are collapsed with an occurrence count to cut noise, and the feed can be narrowed by type, severity, a free-text needle (path, status, SQL, or exception class), and an errors-only quick toggle — the chosen filters are persisted in the browser so they survive a reload. A small requests-over-time sparkline above the table makes spikes and error bursts (drawn in red) visible at a glance. A KPI strip across the top summarises requests per minute, error rate, p50/p95 latency, SQL rate, (Spring servlet/WebFlux only) outbound REST-call error rate/p95 latency, the slowest recent endpoint, active exception count, health status, heap usage, (Spring servlet/WebFlux only) the cache hit ratio, and scheduled-task failure count, computed from the same buffers (sub-millisecond SQL is shown as <1 ms). Several KPI cards are themselves launchpads: the outbound-errors card opens REST Client, the slowest-endpoint card opens HTTP Exchanges pre-filtered to that endpoint, while the active-exceptions, health, heap-usage, cache-hit-ratio, and scheduled-failures cards jump to the Exceptions, Health, Heap Dump, Cache, and Scheduled Tasks panels respectively. Because the merged feed is genuinely event-driven, it refreshes over Server-Sent Events instead of fixed-interval polling: the browser subscribes to /bootui/api/activity/stream and re-fetches whenever any source signals a change (a new request, SQL statement, REST client call, exception, security event, cache access, scheduled-task run, Kafka message, or captured email), and the feed can be paused and resumed so a row you are inspecting does not scroll away. When the feed is unfiltered, correlated signals are nested chronologically under the request that produced them: the SQL statements, REST client calls, exceptions, security events, cache accesses, and emails that BootUI can pin precisely to a request — by trace id, by the request's serving thread, or by request method and path — are folded into a collapsible group beneath that request row (expanded by default), so one click reveals exactly what a single request did, in order. Requests that triggered a security event are flagged as authenticated — a lock icon plus a gray pill naming the caller's principal — so a secured call and who made it are obvious without opening the profiler, and the nested child rows are shaded a distinct gray so they read clearly as belonging to the request above them. Signals that cannot be tied to a request stay top-level, and applying any filter or free-text search flattens the feed again so the query spans every signal.
Every row is also a launchpad: clicking anywhere on a request row opens its profiler, and each row carries a deep link that jumps to the dedicated panel with the originating record pre-filtered — requests open in HTTP Exchanges, SQL in SQL Trace, REST client calls in REST Client, exceptions in Exceptions, cache accesses in Cache, scheduled-task runs in Scheduled Tasks, and captured emails open the very same message's detail drawer in Email (the MAIL entry's id is the captured message's own id, so the link opens that exact email rather than only a filtered list). REST client calls nest under their correlated request in the stream using the same trace-id-first, serving-thread-second join described below for SQL, exactly like cache accesses and emails — but, unlike SQL, exceptions, and security events, none of REST client calls, cache accesses, or scheduled-task runs are yet part of the per-request profiler drawer's correlated timeline or Copy profile export; that correlation, and the N+1-style "chatty" badge, stay scoped to the REST Client panel itself for now. The per-request profiler drawer is a Symfony-style view that correlates that single request's signals using a tiered join that degrades gracefully and never fabricates data: the distributed trace is matched by trace id, exceptions are matched by request method, path, and time window — and, when the request's serving thread is uniquely known, further disambiguated by that thread so a concurrent identical request cannot steal the occurrence — security audit events are matched by time window and the request principal (so an AUTHENTICATION_SUCCESS or AUTHORIZATION_FAILURE raised while serving a secured endpoint is linked to that very request) — and, like SQL, are pinned exactly to the request's serving thread when BootUI captured the audit event on it, so two concurrent requests sharing a principal no longer trade security events; an event proven to have fired on another thread is excluded and an on-thread one is badged exact. SQL is matched exactly by trace id when Micrometer Tracing is present (BootUI threads the active traceId from the SLF4J MDC onto each captured statement). When no trace id is available — the common local-dev case — SQL is still matched exactly by the request's serving thread within its handling window: a servlet request runs start-to-finish on one worker thread that serves only one request at a time, so statements on that thread are unambiguously its own. Only when the serving thread cannot be uniquely identified (for example two genuinely concurrent identical requests, or SQL run on an async thread) does SQL fall back to a time-window heuristic, which is then clearly labelled approximate in the drawer; identical repeated SELECTs above bootui.activity.n-plus-one-threshold are flagged as a potential N+1, and each flagged group lists the distinct call site(s) in your own application code that issued it — the class, method, and line captured by SQL Trace's call-site capture (bootui.sql-trace.capture-call-site, on by default) — so you know exactly which repository or service method to go fix. The drawer also shows the request's timing breakdown (time spent in SQL versus the rest), its auth/principal context, and the trace span list, can be dismissed with the Escape key (with focus trapped inside while open), and offers a Copy profile action that exports the already-masked correlated timeline (request + SQL + exceptions + security events, including any flagged N+1 call sites) as plain text to paste straight into a bug report.
The panel inherits BootUI's full safety model (loopback filter, Host allow-list, cross-site write defenses, value masking); its reads are read-only, and its one state-changing action (switching to a database, described below) is confirmation-gated and blocked like any other action when the app or panel is read-only. The stream is capped by bootui.activity.max-entries, the slow-request threshold is bootui.activity.request-slow-threshold-ms, and individual sources can be turned off through their existing bootui.panels.* toggles (a disabled source simply drops out of the stream).
When Kafka support is present, BootUI captures producer/consumer activity into the stream as MESSAGING entries. On Spring, it wraps every application-owned KafkaTemplate (a ProducerListener) and @KafkaListener container factory (a RecordInterceptor) — composing with, never replacing, any listener/interceptor the application already configured, exactly like HttpExchangesController's repository wrapper. On Quarkus, it hooks SmallRye Reactive Messaging's Kafka interceptors. Each entry records topic, partition, offset (for consumed records), a hash of the key, direction (→/← for produce/consume), success/failure, and — for consumed records — the consumer group id, a listener identifier, and processing duration (a producer send's duration is not exposed by either framework's callback, so it is not tracked). That listener identifier is intentionally framework-specific: on Spring it is currently the listener container factory bean name (the per-@KafkaListener id is not exposed at the factory-wide interception point), while on Quarkus it is the channel name. The message value/payload is never captured — only metadata — since a Kafka payload is an arbitrary, potentially large and sensitive application object with no generic masking strategy. Kafka entries are top-level in the feed today (not yet nested under a correlated request). Capture is on by default whenever the relevant Kafka integration is present and the panel is enabled, and can be tuned or disabled entirely via bootui.kafka.enabled, bootui.kafka.capture-key, bootui.kafka.max-entries, and bootui.kafka.max-key-length — see docs/PROPERTIES.md.
By default the stream is in-memory only, so history is lost on a restart and the feed can only show as far back as the small buffers behind it reach. Setting bootui.activity.persistence.enabled=true additionally buffers captured entries and flushes them to a SQL database over direct JDBC every bootui.activity.persistence.flush-interval (5 seconds by default), so history survives a restart and the dashboard can page back much further. The backing table (bootui.activity.persistence.table-name, default bootui_activity) is created automatically the first time it is needed, and several BootUI instances — for example several replicas of the same application — can safely point at the same table: each instance tags its own rows with an instanceId (defaulting to the HOSTNAME environment variable) and never reads or prunes another instance's rows. Recently captured entries are visible in the dashboard immediately, even before they have been flushed, because reads always merge the in-memory buffer with the durable store; if a flush ever fails, its entries are put back in the buffer rather than lost, and are retried on the next flush. Once persistence is confirmed on, the panel gains a Load older button beneath the stream that pages further back into history, and the type/severity/free-text filters are additionally pushed to the database as a real query instead of only filtering the entries already on screen; a small "· persisted history" note next to the panel subtitle confirms durable storage is active. By default (persistence off) none of this changes anything: no extra bean, thread, or connection is created, and the feed behaves exactly as before. See docs/PROPERTIES.md for the full list of bootui.activity.persistence.* properties, including how to point at a small dedicated connection instead of reusing the host application's own DataSource.
Turning persistence on does not require editing configuration or restarting the app. Whenever it is not yet active, a "Currently saving N events in memory" tip appears next to the panel title alongside a Use a database button; opening it reveals setup documentation and, if the application already has a DataSource bean, a Use the existing datasource action. That action is confirmation-gated exactly like other destructive/state-changing actions elsewhere in BootUI (Flyway migrate/clean, Liquibase update, Cache clear): once confirmed, it checks the current datasource, creates the backing table if it does not already exist, and hot-switches the running instance from the in-memory buffer to durable storage — with no dropped entries and no restart. This switch is runtime-only: it changes nothing on disk, so a later restart reverts to the in-memory default unless bootui.activity.persistence.enabled=true is also set in configuration. If no DataSource is present, the button instead links straight to the setup documentation for configuring one (a dedicated one, just for Live Activity, or reusing an existing one).
On Quarkus the panel merges seven signals: HTTP requests (from the same Vert.x-fed ring buffer as HTTP Exchanges), SQL trace, exceptions, security events, scheduled-task runs, Kafka producer/consumer activity, and captured emails, alongside JVM heap KPIs. Cache accesses and outbound REST-client calls (REST_CLIENT) are Spring-servlet/WebFlux-only today (see their own sections above) — neither has a Quarkus capture seam yet, so both slots stay empty/unavailable there. SQL trace contributes only when a JDBC datasource is configured (the recorder is gated on Agroal); when none is present those entries drop out and the report carries a clear note. Signal-to-request correlation works by trace id: Spring's thread-per-request anchor is unportable on the Vert.x event loop (a thread does not map to a single request), so when quarkus-opentelemetry is present the adapter stamps the active server span's trace id at each capture point — the HTTP filter, the SQL recorder, the exception store, and the CDI security-event observer — and the engine nests SQL, exception, security, and email entries under the request sharing that trace id, exactly as on Spring (scheduled-task runs and Kafka activity always stay top-level, as described above); the OpenTelemetry context propagates across the event-loop→worker hop, so the same trace id is available even for blocking JDBC on a worker thread or a security event fired from a CDI observer. A request whose trace id uniquely matches a correlated security event is flagged authenticated exactly like Spring, naming the audit event's principal; Quarkus's own security layer authenticating the caller (surfaced directly on the captured HTTP exchange) takes precedence over a correlated audit event when both are known. With OpenTelemetry absent, entries carry no trace id and the feed renders flat. The per-request profiler drawer (the Symfony-style drill-down, GET /bootui/api/activity/{id}) is available on Quarkus too, but in a reduced, trace-id-only form: when the request carries a trace id it correlates SQL, exceptions, and security events that share that exact trace id (sqlCorrelationApproximate: false, since trace-id matching is exact); it does not attempt Spring's time-window/thread-based tiers for requests without a trace id, since those lean on serving-thread identity that the Vert.x event-loop model has no equivalent for. Without quarkus-opentelemetry present — or for a request that has no trace id captured — the drawer honestly reports itself unavailable with a clear reason rather than fabricating a partial profile (see docs/QUARKUS-SUPPORT.md for the detailed reasoning). N+1 detection, its list-level row badge, and call-site capture are computed by the same shared engine code Spring uses (the correlation tier above only changes which SQL gets grouped, never how a group is flagged or its call sites collected), so a Quarkus request that resolves any SQL correlation gets byte-identical N+1 flagging to Spring.
The optional durable persistence backend described above is available on Quarkus too, with an identical config surface, wire contract, and shared engine machinery (ActivityStore/BufferedActivityStore/JdbcActivityStore). A dedicated QuarkusActivityCapture CDI bean owns the capture-poller lifecycle (starting it at @Observes StartupEvent and stopping it, with a final flush, at @Observes ShutdownEvent) where the Spring adapter instead wires the same poller/coordinator inline in its controller. One narrower, pre-existing gap carries over: because Quarkus's baseline feed has no server-side type/severity/since filtering to begin with (see above), those filters only take effect on Quarkus once persistence is switched on. The runtime "Use the existing datasource" switch described above works identically on Quarkus: the same engine-level ActivitySwitchService backs a thin JAX-RS mirror of Spring's endpoint, so the tip, button, and confirmation flow behave the same regardless of adapter.
On Spring Boot WebFlux the panel is available too, merging all nine signals like the servlet adapter does. Seven of them needed no new capture pipeline at all: HTTP requests, SQL trace, exceptions, security events, scheduled-task runs, Kafka producer/consumer activity, and captured emails are each already reactive-safe — their engine beans live in the shared BootUiEngineConfiguration both the servlet and reactive auto-configurations import — so the WebFlux port is purely a merge over those existing sources (see their own sections below). The remaining two needed one each. Cache accesses reuse the exact same CacheActivityRecorder/CacheActivityCacheManagerBeanPostProcessor pair the servlet adapter uses — both wired once in that same shared configuration so servlet and WebFlux behave identically — rather than a WebFlux-specific implementation. Outbound REST/WebClient calls work the same way: the shared RestClientTraceRecorder + Spring Boot client customizers live in that common engine wiring too, so a WebFlux application's own WebClient calls are captured and merged here as well. Correlation is trace-id only for cache and REST-client entries — the same shared-engine rule SQL/exceptions/security already use on WebFlux and Quarkus — because Reactor Netty has no thread-per-request model to correlate by (a request isn't served start-to-finish on one dedicated worker thread), so the servlet adapter's thread-based/time-window correlation tiers, including its serving-thread fallback for CACHE (the same one it uses for SQL), do not apply. It is still narrower than on Quarkus in one respect: the HTTP exchange capture shared with the servlet adapter does not stamp the active tracing span's id at capture time the way Quarkus's Vert.x filter does, so a request only carries a trace id when the inbound call itself propagates one (for example a traceparent header from an upstream caller), not merely because micrometer-tracing/OTLP is configured server-side; SQL, exception, security, cache, and REST-client trace ids all fall back to the same SLF4J MDC value the servlet adapter already uses, whose propagation across Reactor's event-loop→worker-thread hop for blocking calls is best-effort rather than guaranteed. When a shared trace id is present on both sides, matching signals nest under the request exactly as on Quarkus; without one, every signal still appears in the feed, just flat/top-level rather than nested per-request. The per-request profiler drawer is available too, in the same reduced, trace-id-only form as Quarkus: it correlates by exact trace id when the request has one, and honestly reports itself unavailable rather than fabricating a partial profile when it does not. N+1 detection, its row badge, and call-site capture are computed by the same shared engine code as every other adapter, so a WebFlux request that resolves a trace-id correlation gets byte-identical flagging to Spring MVC and Quarkus. The optional durable persistence backend and the "Use the existing datasource" hot-switch described above work identically on WebFlux too, over the same shared engine machinery. The dedicated REST Client panel itself is still not available on WebFlux — only its capture and Live Activity merge are. See docs/WEBFLUX-SUPPORT.md for the full detail.
GitHub
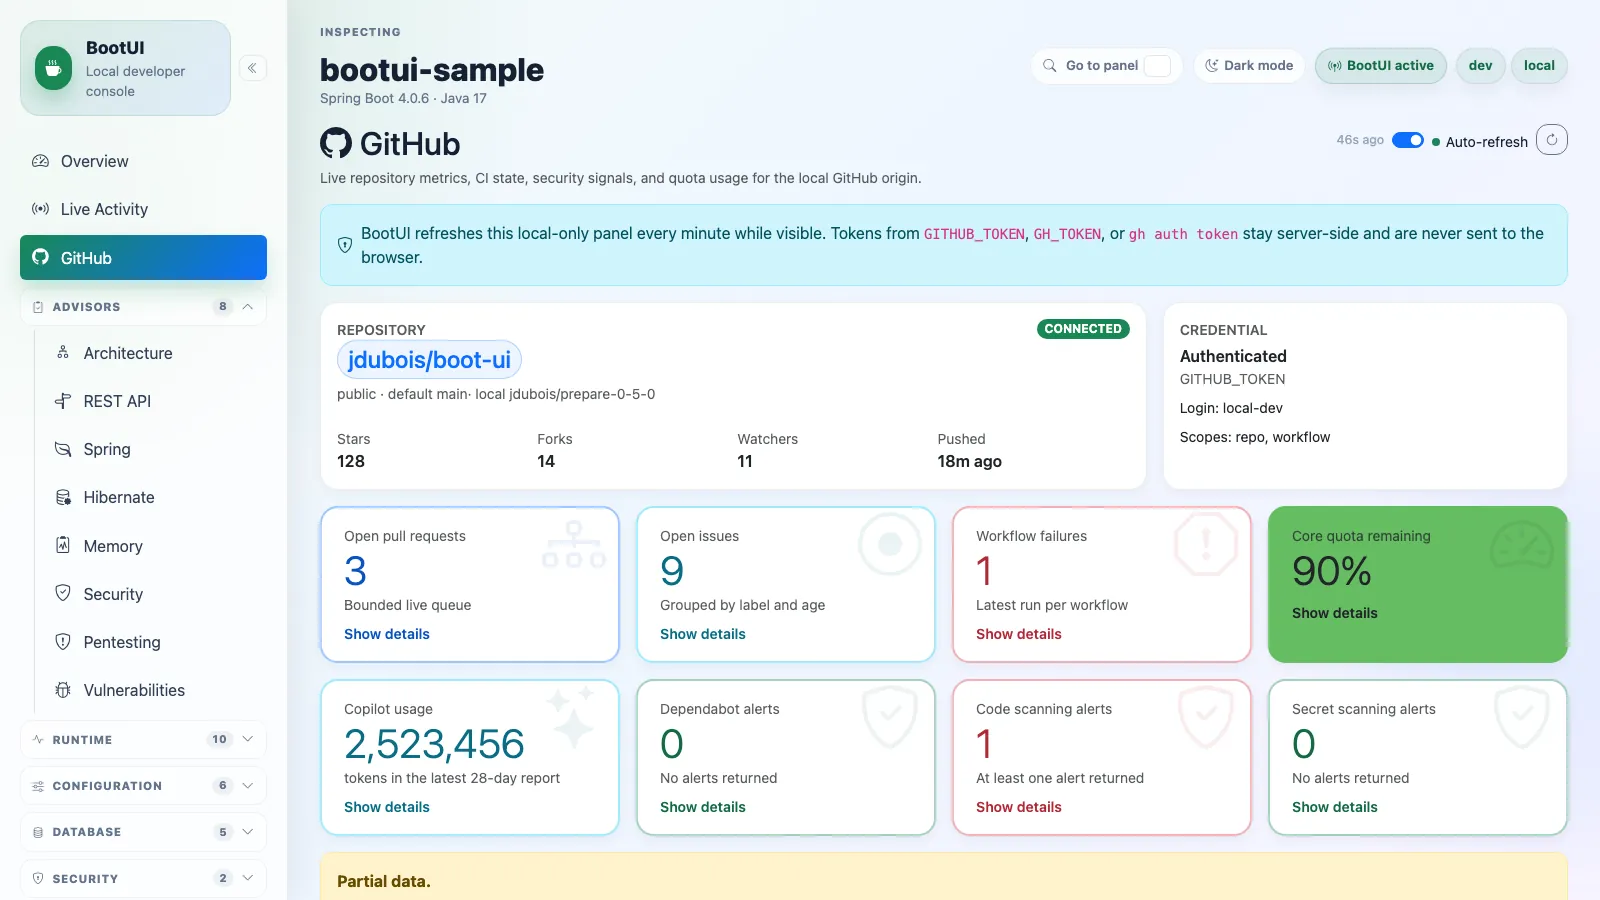
The GitHub panel sits in the Overview group and summarizes the current project's GitHub state from the local origin remote. It uses BootUI's standard auto-refresh control with a one-minute interval while the tab is visible; the initial refresh and each interval are bounded and blocked by the panel's read-only settings.
The panel shows repository metadata and an eight-card summary grid with click-through detail drawers for open pull requests, open issues, the latest GitHub Actions executions, quotas, Copilot usage report availability, and the three security signals. The open-issues drawer summarizes the label/staleness buckets and then lists the bounded set of open issues returned by the refresh, linking each to its issue page with its author, labels, comment count, and last-updated time (pull requests returned by the issues endpoint are excluded). GitHub Actions execution rows link to the matching run, show the workflow, branch, event, status, and duration, and mirror the recent-run list from the GitHub Actions page. The workflow failure count only considers the latest execution for each workflow and branch, so older failures drop out once a later run fixes that workflow on that branch; security signal drawers link to the matching GitHub alert pages. The Dependabot drawer additionally lists the bounded set of open alerts with their package, ecosystem, severity, advisory ID, summary, affected range, and fixed version (capped by bootui.github.max-security-alerts); code scanning and secret scanning stay count-only and never inline secret values or vulnerable code snippets. The quota card shows the lowest remaining quota percentage with a red-to-green threshold palette. The quota drawer is hidden by default, renders every resource returned by GitHub's /rate_limit response dynamically, highlights resources with 10% or less remaining or at quota, then adds best-effort cards for repository or owner quotas such as Actions cache, artifacts, and Actions billing when the credential can access those endpoints. Copilot usage uses GitHub's organization report metadata endpoint when available; BootUI shows the report window and link count only, without downloading or exposing signed report URLs.
Credentials are read from the current device only: GITHUB_TOKEN, GH_TOKEN, or an existing gh auth token login. The token is never sent to the browser, persisted by BootUI, or included in warnings; without a token, public repositories use GitHub's unauthenticated rate limits. Refreshes are bounded by per-request timeouts, a maximum API-call budget, and a quota safety threshold that skips optional sections before exhausting the core API quota.
On Quarkus the panel is identical, running over the same framework-neutral engine GitHubDashboardService and the same /bootui/api/github contract. The Quarkus adapter supplies a Jackson 2 (com.fasterxml.jackson.*) GitHubClient implementation in place of the Spring adapter's Jackson 3 one — the only difference, since Quarkus ships Jackson 2 while Spring Boot 4 ships Jackson 3 — and reuses the shared, framework-free DefaultGitHubTokenProvider (env tokens + gh CLI) for credentials. The same bootui.github.* keys and defaults bind from MicroProfile Config, panel availability is computed the same way (the host application's working directory is a GitHub-origin git checkout on an allow-listed API host), and the no-network-on-render rule holds: GET /bootui/api/github never calls GitHub, and only the explicit POST /bootui/api/github/refresh action does (gated by bootui.github.api-enabled and the host allow-list).
Advisors
BootUI's advisors run explicit, on-demand rule-based scans and surface severity-ranked findings, feeding the weighted score on the Overview dashboard. Each advisor inspects a different facet of the application — compiled architecture, the REST layer, the live Spring context, persistence, JVM memory, and security posture — and is read-only. Once an advisor has run, its panel shows the same 0–100 score the Overview computes for it (100 minus the weighted finding penalty), so each panel and the dashboard always agree.
Every advisor finding can be dismissed when it does not apply to your project. Each rule result carries a Dismiss button; dismissing a rule moves it into a collapsed "Dismissed rules" list at the bottom of the panel and excludes it from the panel's finding count, severity bars, the panel's own advisor score, and the weighted Overview score. The panel's score recomputes immediately, and the Overview dashboard — which stays mounted in the background — re-reads the advisor's score when you return to it, so dismissing or restoring a finding is reflected in both places. Dismissed rules can be restored at any time from that list. Dismissals are applied server-side and persisted under the dismissedRules node of a local .bootui/boot-ui.yml configuration file (next to the runtime overrides file), so they survive restarts and stay consistent between each panel and the Overview dashboard. The file is developer-local and intended to be git-ignored; rule identifiers are globally unique across advisors, so a dismissal always targets exactly one rule.
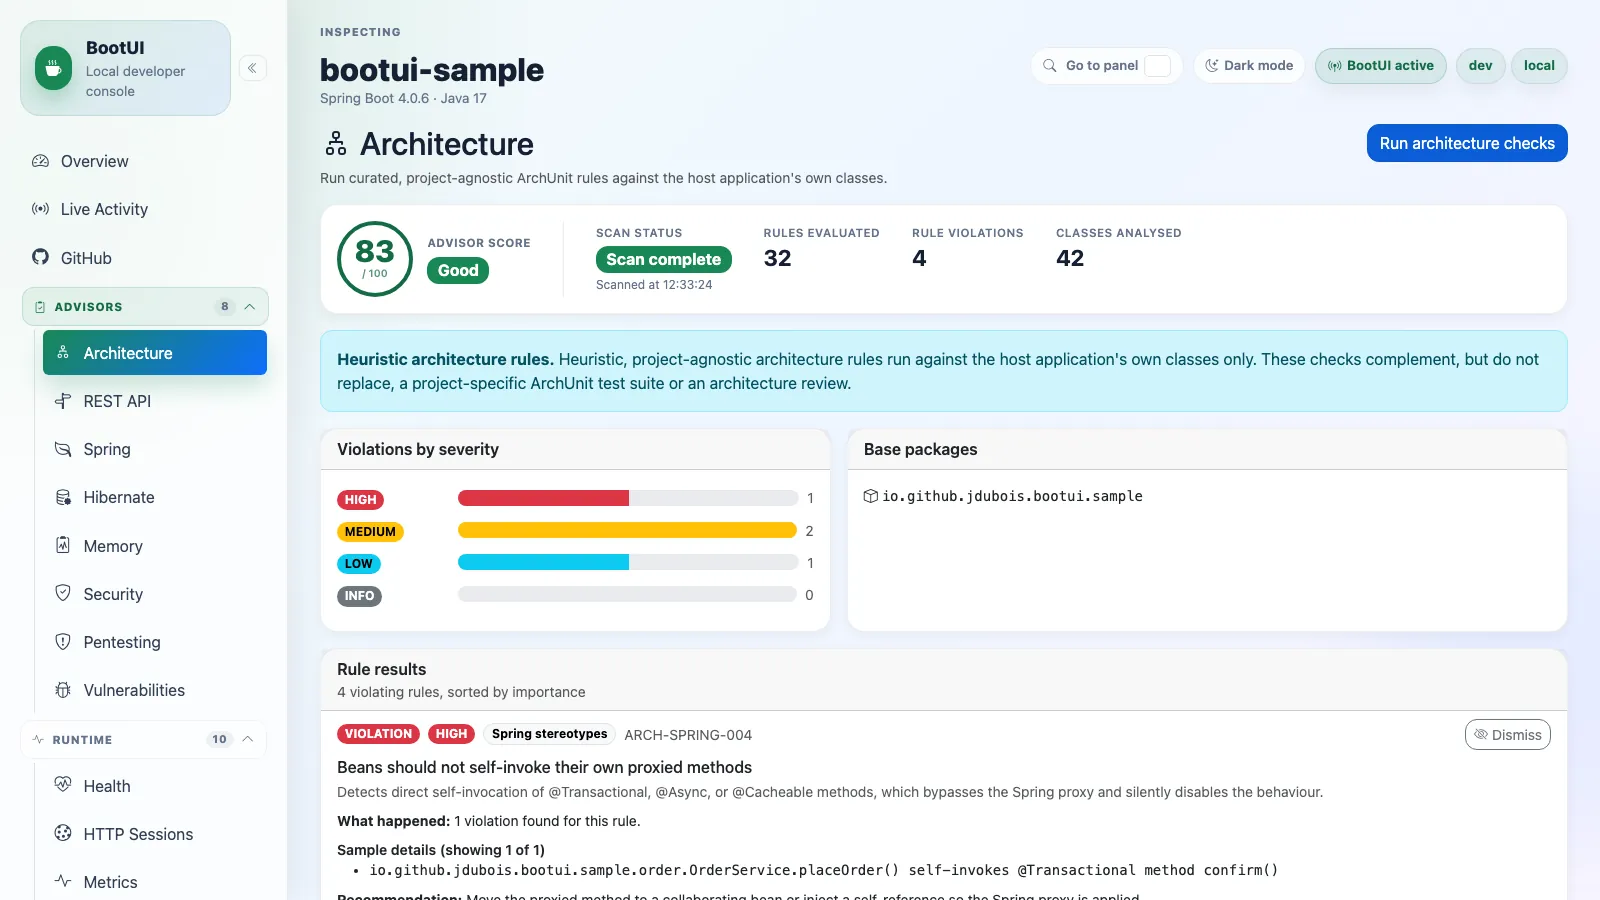
Architecture
The Architecture panel runs a curated, zero-config ArchUnit ruleset against the host application's own classes at runtime. It detects the application's base package from the @SpringBootApplication configuration, imports the compiled classes from that package, and evaluates a fixed set of universally-sensible architecture hygiene rules: package cycles between slices, general coding practices (no standard streams, generic exceptions, java.util.logging, JodaTime, printStackTrace, System.exit, JDK-internal APIs, legacy date/time, or deprecated APIs, poorly named exceptions/interfaces, mutable/visible loggers, production dependencies on test frameworks, public mutable static fields, non-final utility classes, standard-annotation (jakarta.inject.Inject / @Resource) field injection, direct Thread instantiation, or message-less assertions), and Spring stereotype/proxy heuristics (no @Autowired/@Value field injection, controllers should not depend on repositories, repositories should not depend on controllers or services, services should not depend on controllers, services and repositories should stay servlet-agnostic, no self-invocation or unproxyable proxy annotations, async/scheduled method signatures should be supported, async should stay out of configuration classes, stereotypes should stay outside the default package, @ConfigurationProperties classes should be immutable, and code should avoid AopContext.currentProxy()). When BootUI is installed through bootui-spring-boot-starter, ArchUnit is included transitively; the panel is available when a base package is resolvable and the scan runs on demand, caching the last report.
Generic rules are necessarily less powerful than project-authored ArchUnit tests, so the panel is positioned as a starting-point and review aid that complements — rather than replaces — a project-specific ArchUnit test suite. Each rule is registered with a stable identifier, category, severity, and recommendation; the rule results list shows only violating rules, sorted by severity and violation count. See ARCHITECTURE-CHECKS.md for the full catalogue of rules and what each one inspects.
Not available in GraalVM native images. The advisor scans compiled
.classfiles via ArchUnit'sClassFileImporter, which is incompatible with a native executable; the panel is automatically hidden when the application is detected to be running as a native image.
On Quarkus the panel is identical, running the same shared ArchUnit ruleset and on-demand scan over the same report contract — the framework-agnostic hygiene rules apply unchanged, while the Spring-stereotype rules simply find no matching classes on a Quarkus application. A handful of these rules are deliberately dual-framework instead of Spring-only, because they also key on the portable jakarta.* annotations a CDI container recognizes: self-invocation and proxy-visibility checks also fire on jakarta.transaction.Transactional, held to the CDI-accurate, more permissive visibility bar (a CDI client proxy can intercept protected and package-private methods, unlike Spring's stricter public-only proxies) so they degrade gracefully rather than false-positive — see ARCHITECTURE-CHECKS.md for the per-rule detail. The one platform difference is base-package discovery: Quarkus has no @SpringBootApplication to read and no reliable runtime package scan under its classloader, so the application's base packages are discovered at build time from the Jandex application index and supplied to the scanner. Discovery is single-module today (sibling modules in a multi-module build are not auto-discovered; the bootui.internal.base-packages config key — a comma-separated package list — overrides it when needed). The scan still runs on demand and caches the last report, and dismissing a rule persists to .bootui/boot-ui.yml exactly as on Spring Boot.
REST API
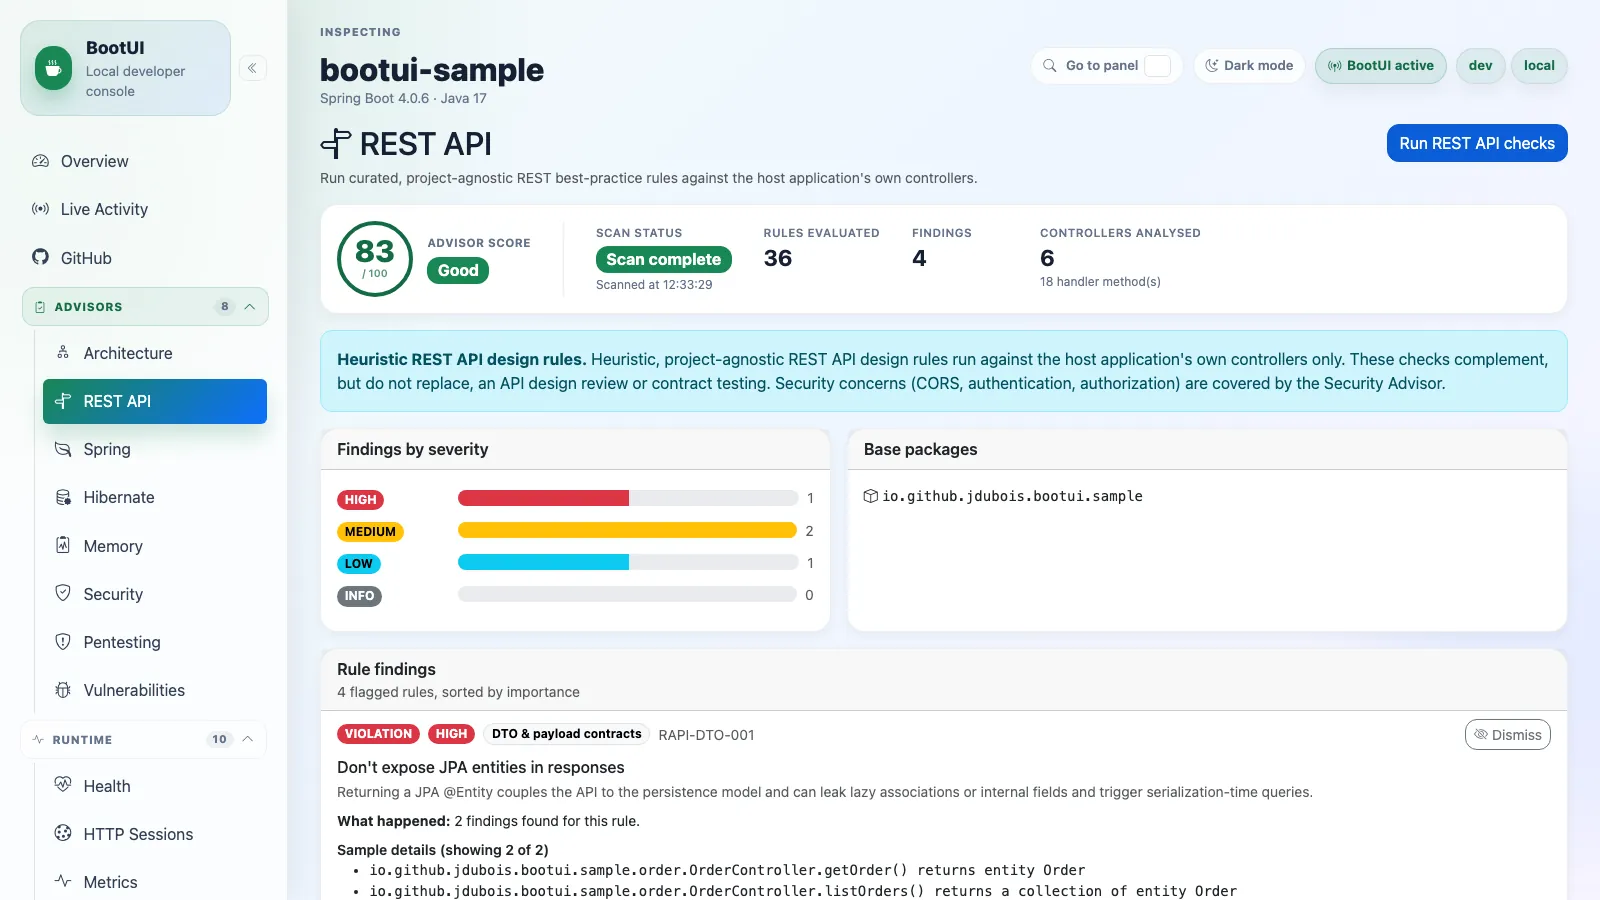
The REST API panel runs a curated, zero-config ruleset against the host application's own web layer (@RestController / @Controller handler methods on Spring or JAX-RS resources on Quarkus) at runtime. Like the Architecture panel, it imports the compiled handlers from bounded application base packages and derives a read-only model — HTTP method(s), path(s), parameters and their annotations, return type, produces/consumes, validation flags, and declared throws. It then evaluates 53 REST best-practice rules across eight categories: routing and HTTP-method mapping, resource naming, status codes and responses, input validation and binding, DTO and payload contracts, pagination, versioning and content negotiation, and error handling and documentation. The RAPI-DOC-* documentation rules only run when Swagger or MicroProfile OpenAPI annotations are on the host classpath.
The advisor deliberately avoids security concerns (CORS, authentication, authorization), which remain owned by the Security panel. The scan runs on demand and caches the last report; each rule is registered with a stable identifier, category, severity, recommendation, and a learn-more link, and the rule results list shows only flagged rules, sorted by severity and finding count. The heuristics complement — rather than replace — an API design review or contract testing. See REST-API-CHECKS.md for the full catalogue of rules and what each one inspects.
Not available in GraalVM native images. The advisor scans compiled
.classfiles via ArchUnit'sClassFileImporter, which is incompatible with a native executable; the panel is automatically hidden when the application is detected to be running as a native image.
Spring
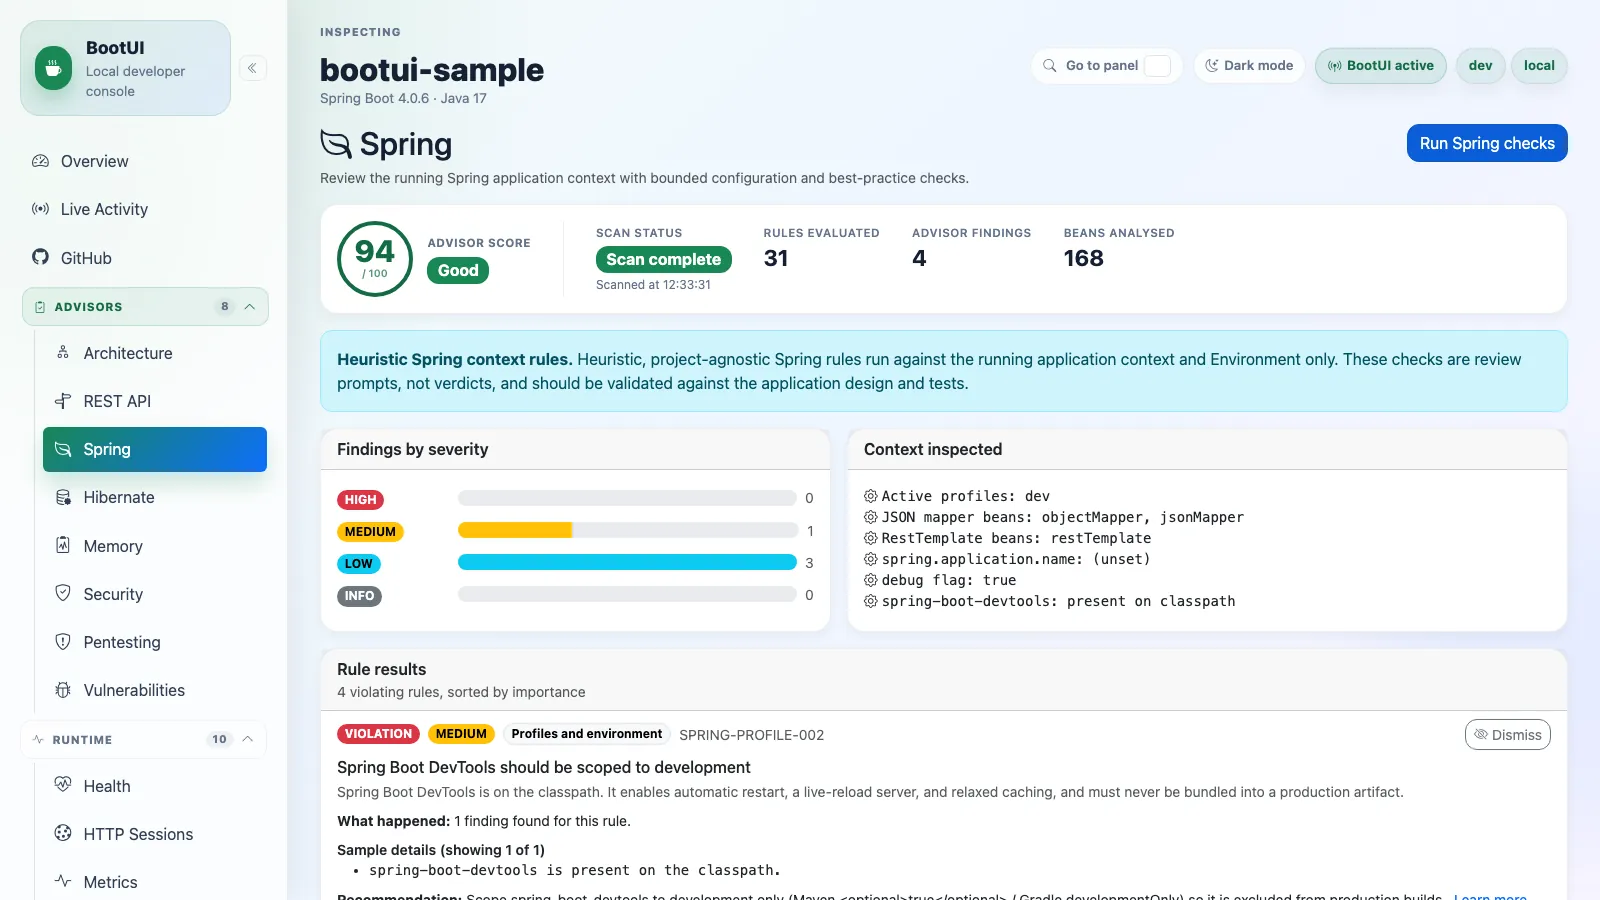
The Spring panel runs an explicit, read-only scan of the host application's running Spring application context and Environment. It takes a bounded snapshot of selected bean groups (Jackson ObjectMappers, TaskExecutors, DataSources) and feature flags, then evaluates a curated ruleset across bean wiring, configuration hygiene, profiles and environment, performance and concurrency (including virtual threads), web/HTTP settings, data and persistence, Actuator/management exposure, and reactive (WebFlux-only) checks. Because it runs inside the already-started application, it focuses on "started but suboptimal" states rather than fatal startup conditions. It complements the Architecture panel, which statically analyzes compiled bytecode with ArchUnit, by inspecting the live, wired runtime context instead. The report is a heuristic review prompt, not a verdict: it never mutates the context, intercepts live traffic, or surfaces secrets. The ruleset detects whether the host is running the servlet (Spring MVC) or reactive (Spring WebFlux) stack and adjusts a handful of rules accordingly — see SPRING-CHECKS.md for the full rule catalogue and remediation links.
This is a single framework-application advisor that is relabelled per framework: it appears as Spring on the Spring Boot adapter and as Quarkus on the Quarkus adapter — the same menu slot, the same /bootui/api/spring contract, and the same report shape. The Quarkus section below covers the Quarkus flavour.
Quarkus
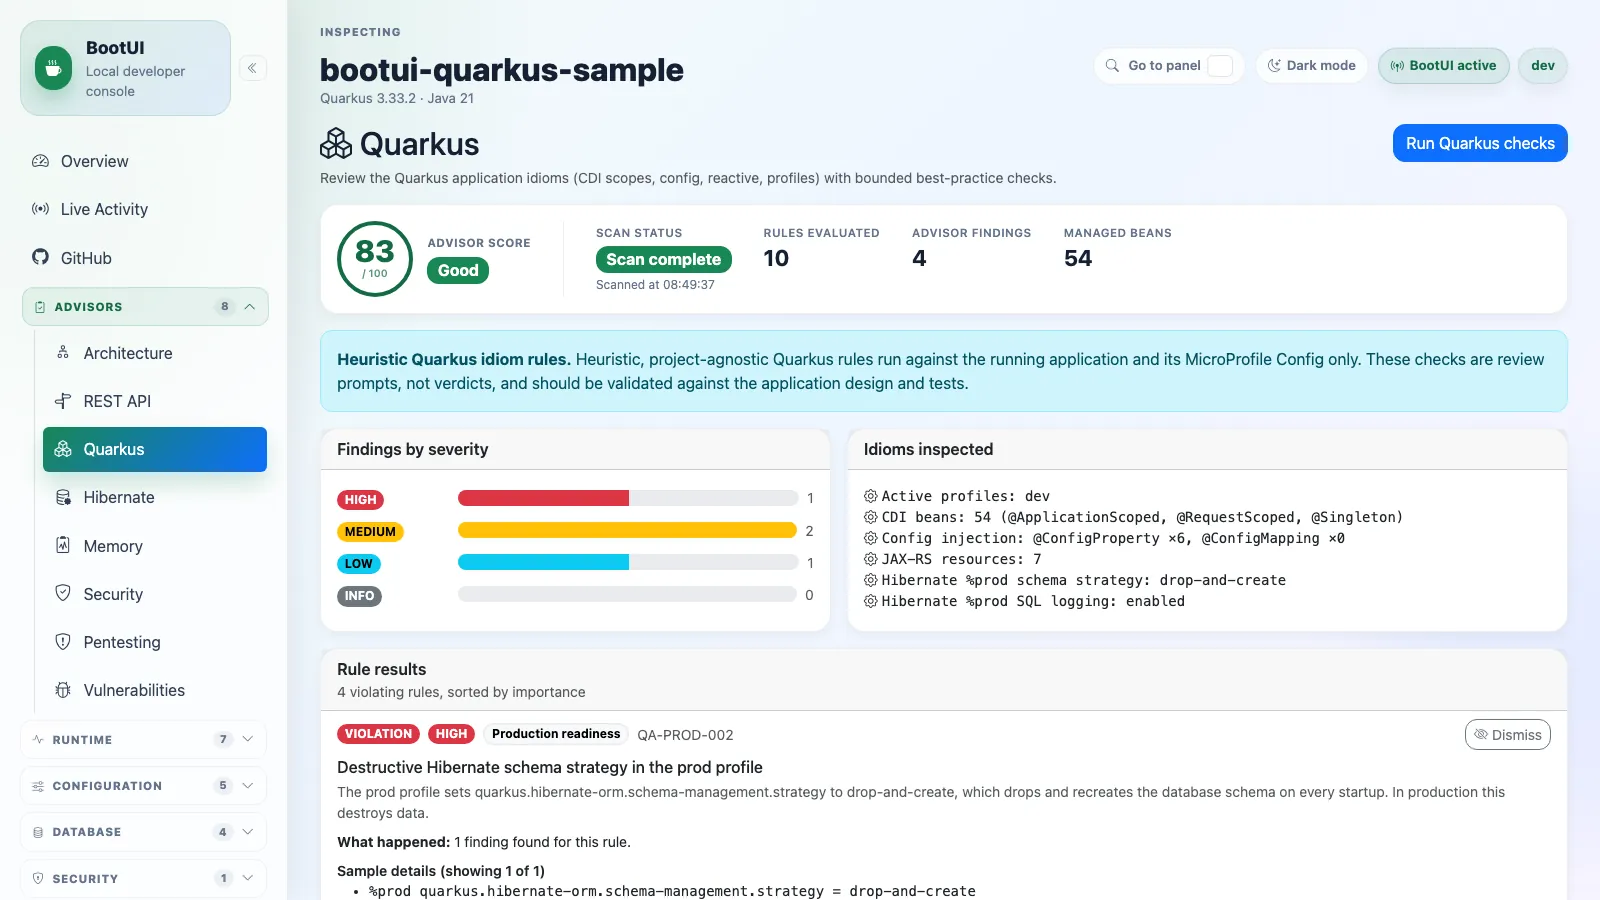
On the Quarkus adapter the framework-application advisor above is relabelled Quarkus and runs a Quarkus-native idiom ruleset in place of the Spring rules. It takes the same explicit, read-only approach — evaluating a curated set of checks against the running application and its MicroProfile Config — but the rules target Quarkus idioms: CDI/Arc scopes and shared mutable state on @ApplicationScoped/@Singleton beans, build-time type-safe configuration (@ConfigProperty vs @ConfigMapping), reactive-versus-blocking endpoints, @Scheduled clustering, and production-profile hygiene (destructive Hibernate schema strategies, SQL logging). It is the same panel and menu slot as the Spring advisor — the same /spring route, /bootui/api/spring endpoint, and report contract — so the shared UI simply renders the "Quarkus" label and Quarkus-flavoured copy. The report is a heuristic review prompt, not a verdict. See QUARKUS-ADVISOR-CHECKS.md for the full rule catalogue and remediation links.
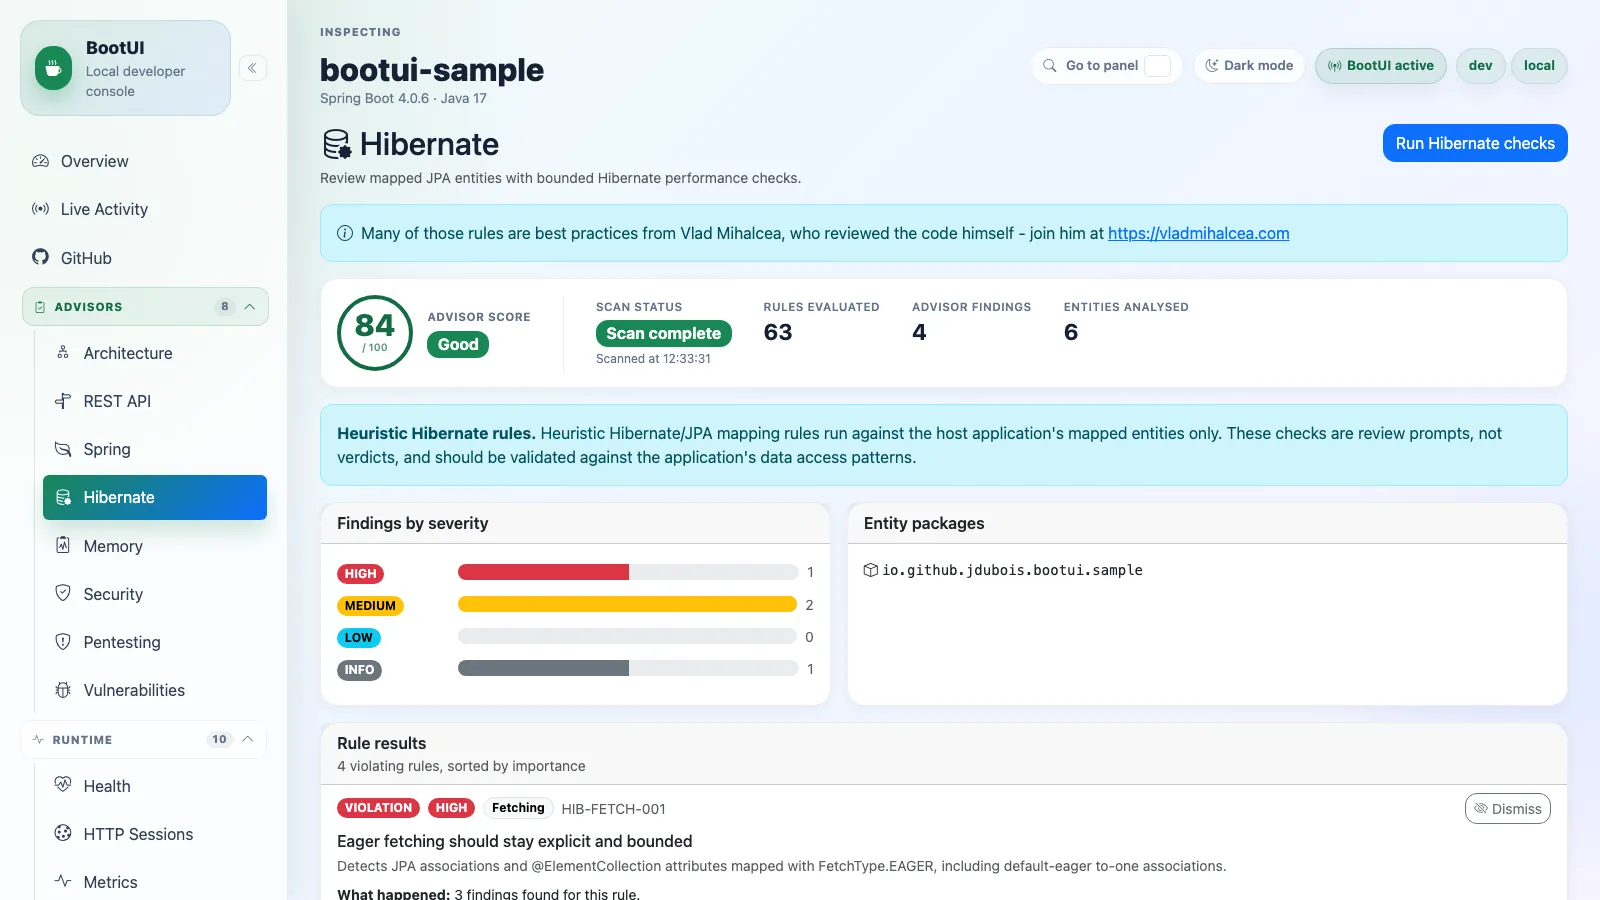
Hibernate
The Hibernate panel runs an explicit, read-only scan against the JPA EntityManagerFactory metamodel when Hibernate ORM is present. It reviews mapped entities, selected persistence configuration, and Spring Data repository metadata for common Hibernate/JPA performance and mapping risks such as eager fetching, problematic identifier generators, collection fetch pagination, unsafe cascades, cache misconfiguration, and risky ddl-auto values. The report is framed as a review prompt, not a verdict: it never intercepts queries, invokes repositories, executes SQL, or modifies mappings. See HIBERNATE-CHECKS.md for the full rule catalogue and remediation links.
On Quarkus the panel is identical, running the same shared rule engine over the same report contract when quarkus-hibernate-orm is present: entities are discovered from the live JPA EntityManagerFactory metamodel (across all persistence units, de-duplicated by identity), and most mapping/identifier/fetch rules apply unchanged. A few platform differences are worth noting. First, persistence configuration is read through a key-mapping layer (QuarkusHibernatePropertyLookup) that translates the Spring/native-Hibernate property names the rules expect onto their Quarkus equivalents — ddl-auto/hbm2ddl.auto → quarkus.hibernate-orm.schema-management.strategy (or the deprecated quarkus.hibernate-orm.database.generation, including the drop-and-create ↔ create-drop value alias), show-sql → quarkus.hibernate-orm.log.sql, format_sql → quarkus.hibernate-orm.log.format-sql, batch_size → quarkus.hibernate-orm.jdbc.statement-batch-size, default_batch_fetch_size → quarkus.hibernate-orm.fetch.batch-size, jdbc.time_zone → quarkus.hibernate-orm.jdbc.timezone, generate_statistics → quarkus.hibernate-orm.statistics, query.in_clause_parameter_padding → quarkus.hibernate-orm.query.in-clause-parameter-padding, query.fail_on_pagination_over_collection_fetch → quarkus.hibernate-orm.query.fail-on-pagination-over-collection-fetch, and both cache.use_query_cache and cache.use_second_level_cache → Quarkus' single unified quarkus.hibernate-orm.second-level-caching-enabled toggle. A native quarkus.hibernate-orm.log.bind-parameters flag is also read as the neutral bind-parameter-logging signal. For any other hibernate.* key with no first-class Quarkus config option (for example hibernate.order_inserts / hibernate.order_updates), the lookup falls back to Quarkus' generic quarkus.hibernate-orm.unsupported-properties."..." escape hatch, which a live-boot test confirmed reaches Hibernate's own bootstrapped settings. Only a handful of genuinely Hikari/Spring-specific signals stay unmapped (Hikari's auto-commit setting, which Agroal has no equivalent for) and their INFO advisories may still cite the Spring-flavored property name. Second, the Open-Session-in-View check is correctly inert on Quarkus: Quarkus has no OSIV concept, so the effective state is always disabled and the rule never fires (on Spring a missing spring.jpa.open-in-view defaults to the web-on behaviour). Third, bytecode enhancement is always considered enabled on Quarkus — it enhances every entity unconditionally at build time with no config-based opt-out — so the two lazy-@OneToOne findings that depend on enhancement being disabled never fire there. Fourth, and specific to Panache active-record entities: once a Panache extension (quarkus-hibernate-orm-panache or quarkus-hibernate-reactive-panache) is on the classpath, its build-time bytecode rewrite makes public-field access on any Hibernate-managed class behave like a getter/setter call app-wide, so the public-persistent-field finding does not fire; and the @GeneratedValue-without-strategy finding ignores the id field Panache's own base entity declares (an application-declared identifier is still checked normally). Spring Data repository hints (missing-strategy-aware isNew() detection for assigned identifiers) are specific to Spring Data JPA's save() semantics: without Spring Data Commons on the classpath — the normal case for a Panache app, whose persist() has no such ambiguity — that whole check is skipped rather than reported.
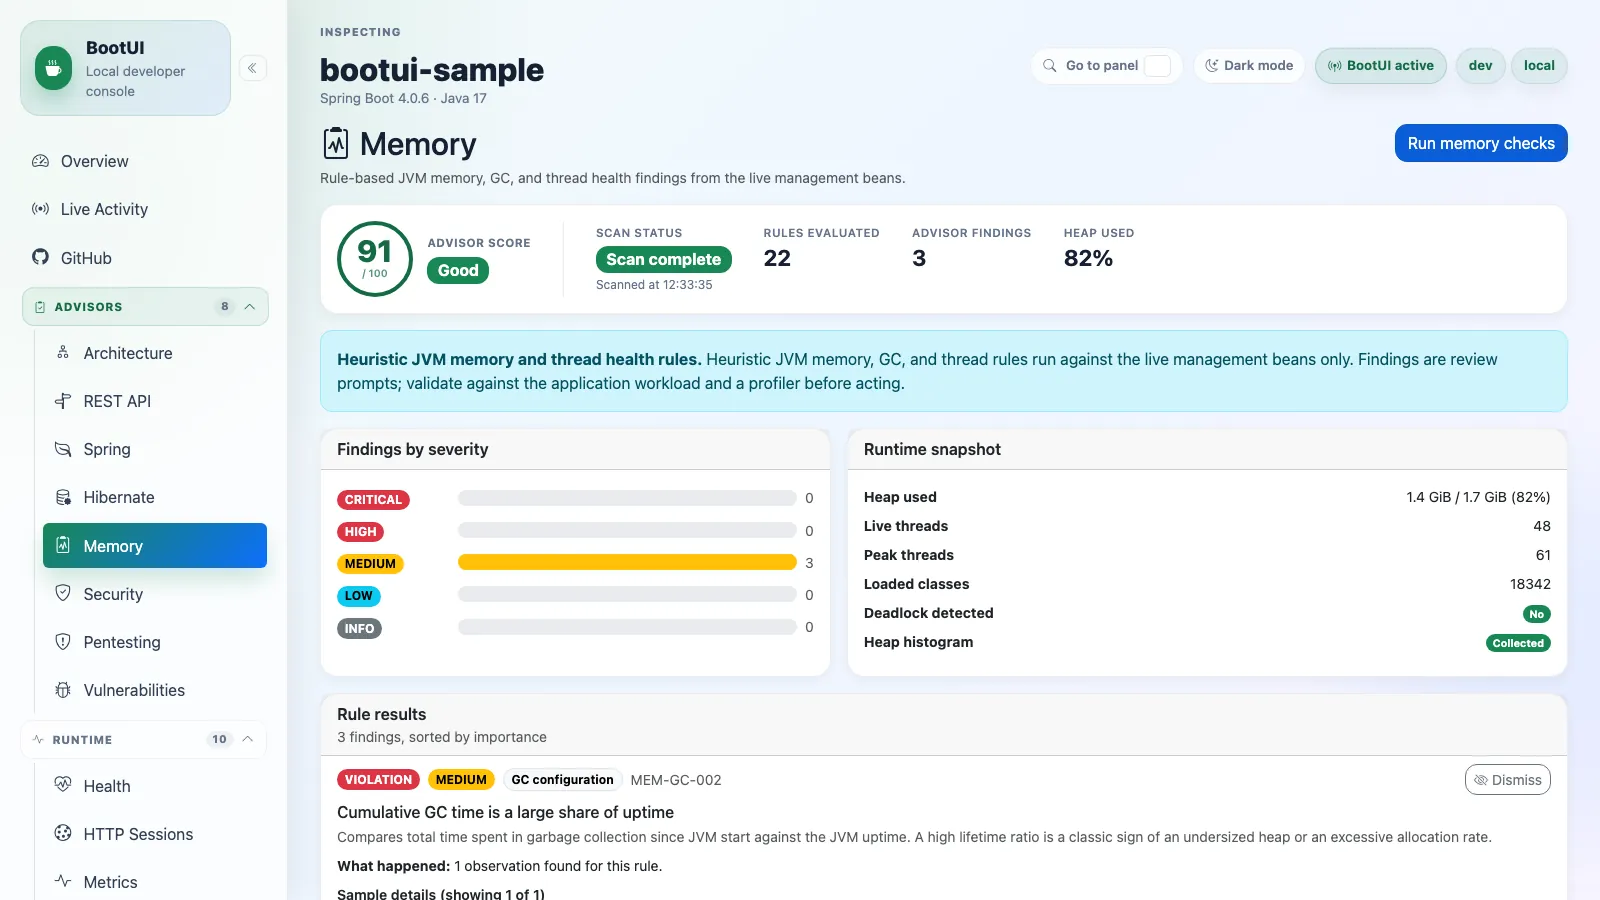
Memory
The Memory panel runs an explicit, read-only scan over the live JVM management beans (heap and memory pools, garbage collection, threads, loaded classes, and an optional class histogram) and turns them into severity-ranked findings such as heap pressure, metaspace saturation, native-footprint risk inside a container, lifetime GC overhead, thread deadlocks, and collection bloat. It complements the raw Live Memory and Threads panels by diagnosing the data they expose. The scan is on demand and caches the last report; new rules are added as small, focused classes in the memory package. See MEMORY-CHECKS.md for the full rule catalogue and remediation links.
Security
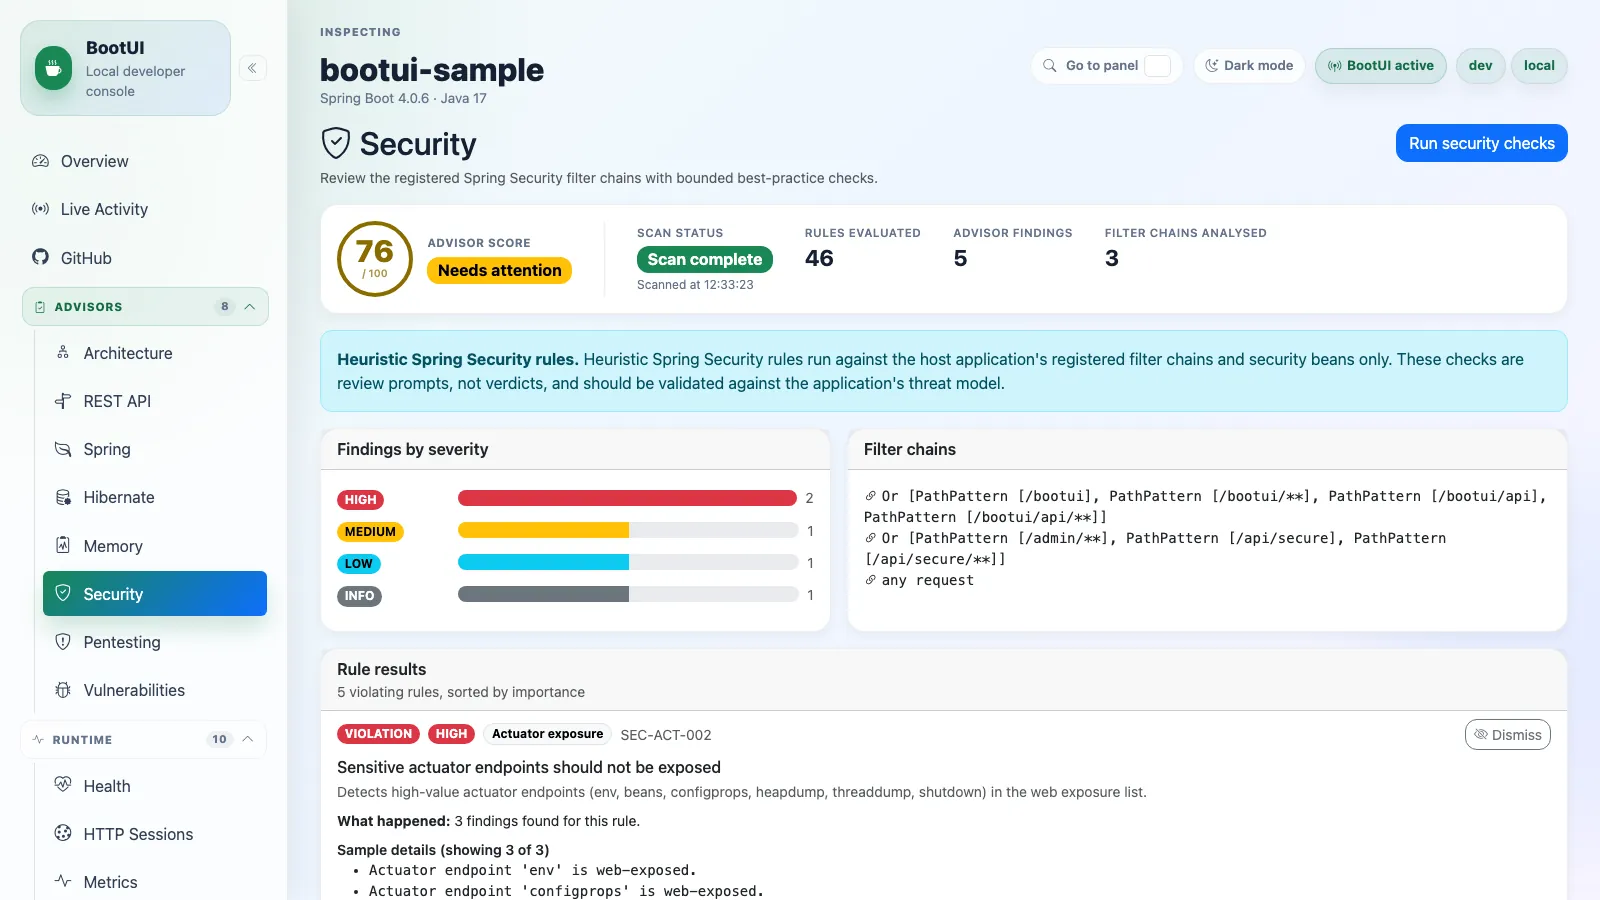
The Security panel runs an explicit, read-only scan of the host application's registered Spring Security SecurityFilterChain beans and related security beans when Spring Security is on the classpath. It introspects the filter lists, simulates an anonymous authorization decision, and inspects security-relevant beans (PasswordEncoder, CorsConfigurationSource, JwtDecoder) and Environment properties to flag common hardening gaps across authentication, authorization, CSRF, session management, transport/security headers, CORS, method security, actuator exposure, OAuth2 resource-server validation, and configuration hygiene. The report is framed as a review prompt, not a verdict: it never intercepts live traffic, exposes credentials, keys, or session identifiers, or modifies the security configuration. See SECURITY-CHECKS.md for the full rule catalogue and remediation links.
The Security advisor supports both framework security stacks from the same panel, menu slot, and /bootui/api/security report contract. On Spring Boot it analyses Spring Security — the SecurityFilterChain beans and security beans described above.
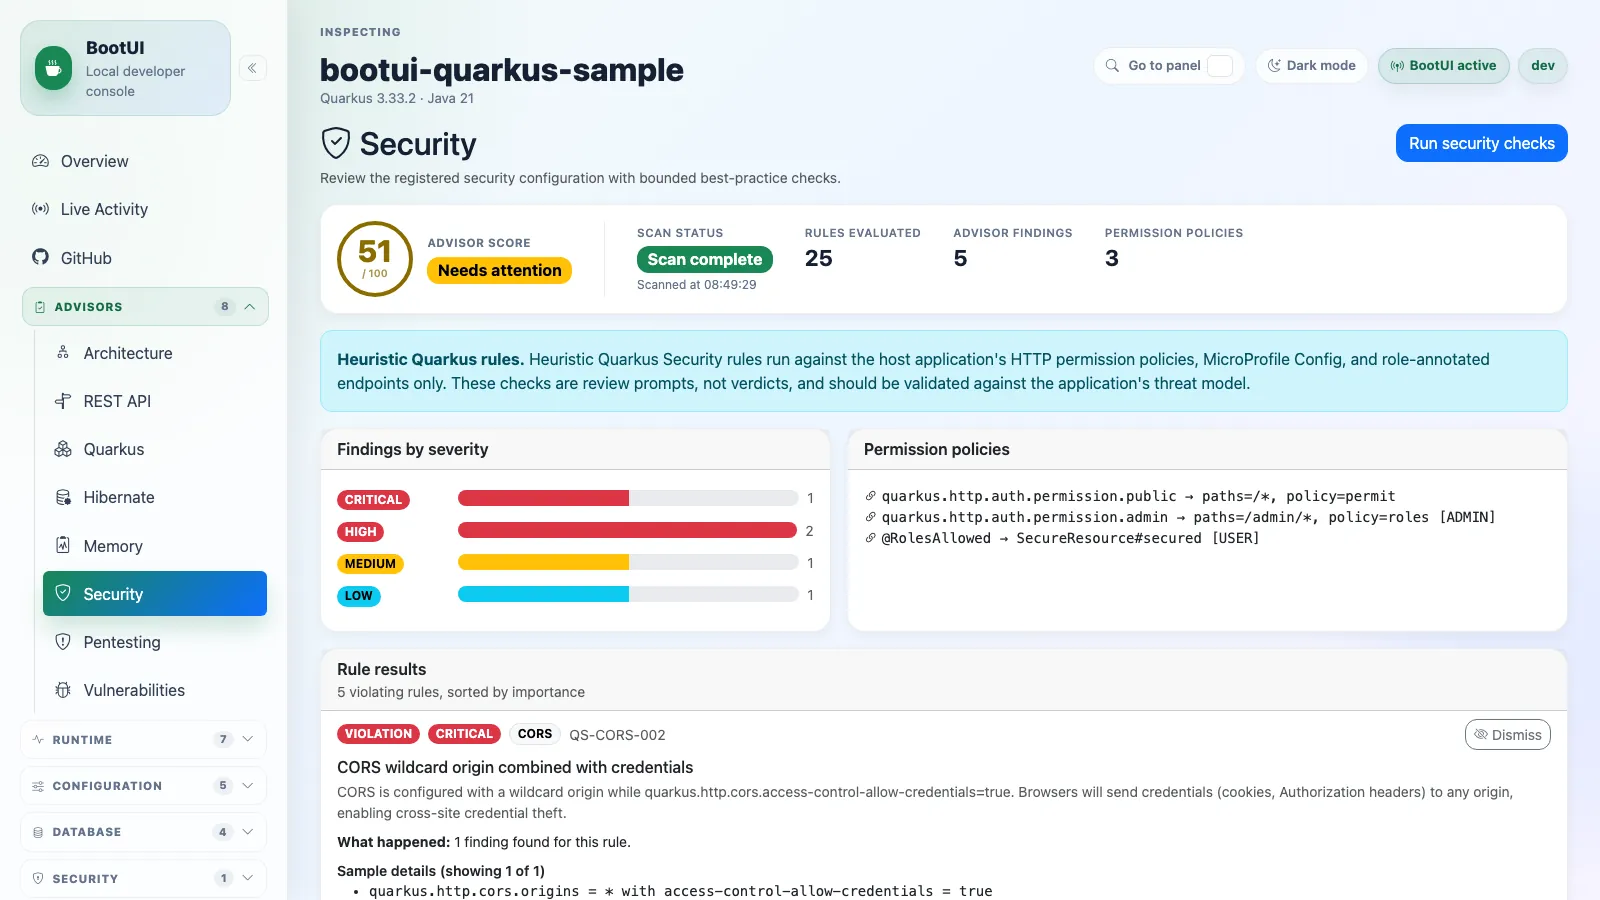
On Quarkus it runs a Quarkus-native ruleset instead, reading the application's HTTP permission policies, MicroProfile Config, and role-annotated endpoints: Elytron/OIDC authentication, quarkus.http.auth.permission.* authorization, TLS and transport policy, CORS (including the wildcard-origin-with-credentials trap), security response headers, and @RolesAllowed/@PermitAll/@DenyAll usage. It surfaces the same severity-ranked review prompts, so the shared UI only relabels the metrics ("Permission policies" in place of "Filter chains") — the panel is otherwise identical. See QUARKUS-CHECKS.md for the full Quarkus rule catalogue and remediation links.
This advisor is not yet ported for Spring Boot WebFlux: it analyzes the servlet SecurityFilterChain beans described above, and a reactive Spring Security setup registers a different bean type (WebFilterChainProxy) instead — so the panel reports unavailable with its existing "no filter chains available" reason rather than a bespoke WebFlux message. A ServerHttpSecurity/SecurityWebFilterChain ruleset is planned as follow-up work. See docs/WEBFLUX-SUPPORT.md for the current status.
Pentesting
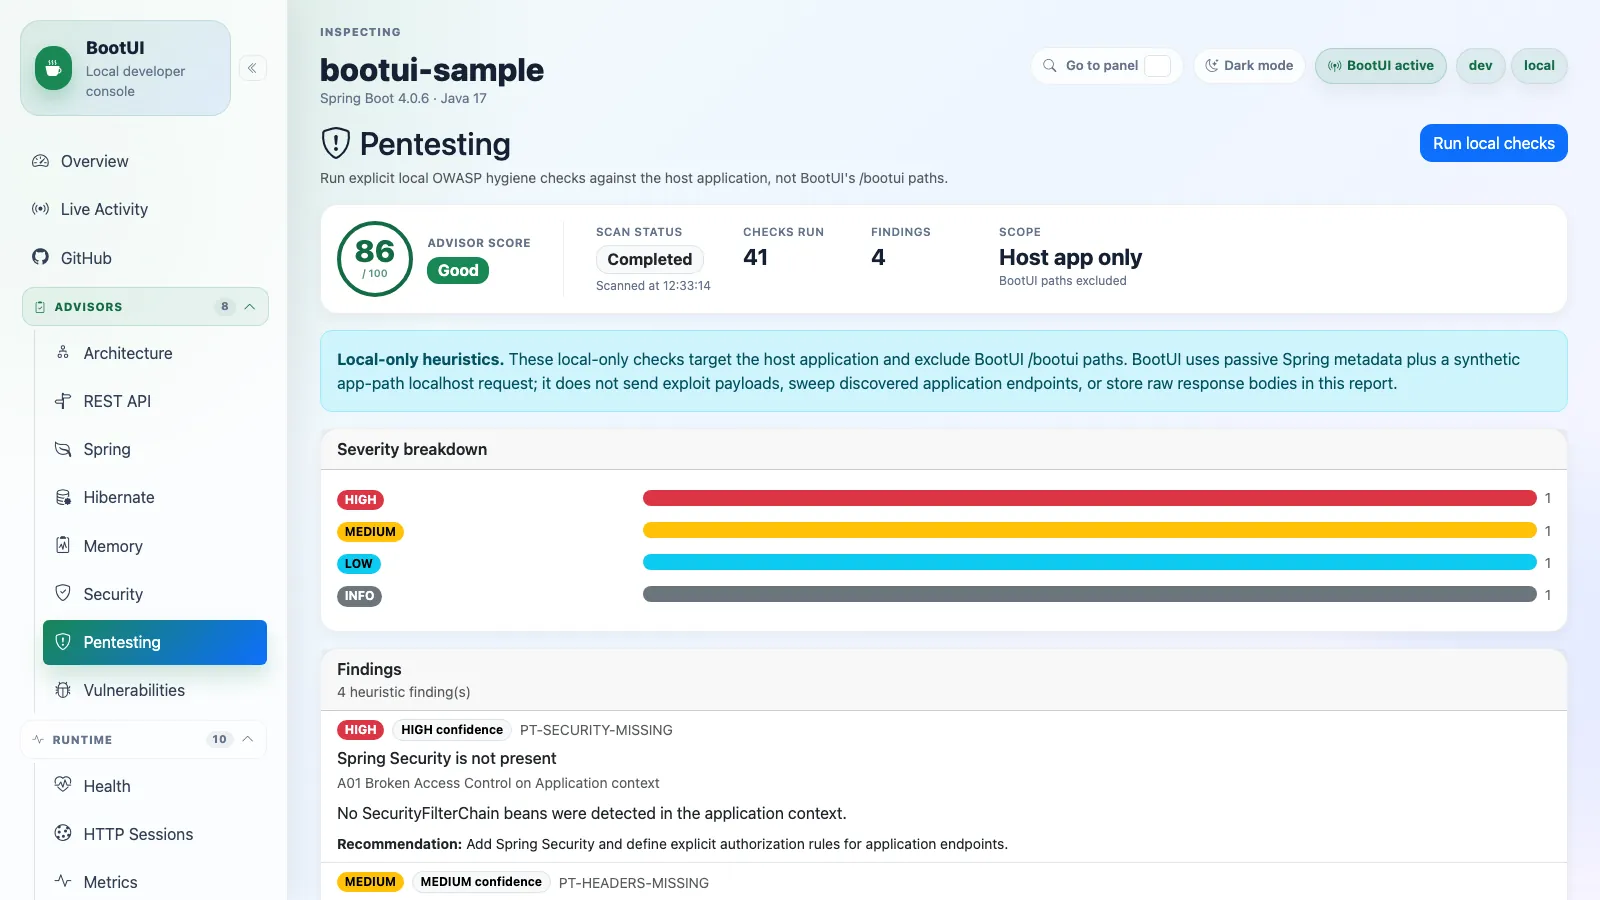
The Pentesting panel runs explicit, local-only OWASP Top 10 2025 hygiene checks against the host application, not BootUI's /bootui routes. It combines passive Spring metadata with bounded synthetic localhost requests under the application context path for missing or unsafe security headers, CORS behavior, cookie flags, verbose error exposure, Spring Security wiring, and actuator exposure. It also inspects Spring Boot configuration for common hardening gaps such as wildcard actuator exposure, health detail exposure, an enabled H2 console, in-config security credentials, value-revealing actuator endpoints, request-detail logging, and DevTools left on the classpath. It intentionally does not sweep discovered application endpoints, send SQL/XSS/destructive payloads, or store raw response bodies. Findings are heuristic review prompts, not proof of exploitability or a replacement for a full security assessment.
Each hygiene check is registered with a stable identifier, OWASP 2025 category, evidence source, and recommendation so new checks can be added without expanding the scanner's HTTP surface. See PENTEST-CHECKS.md for the full catalogue of checks and what each one inspects.
On Quarkus the panel is identical, running the same shared scanner over the same report contract and the same on-demand POST /bootui/api/pentesting/scan action. The framework-neutral value comes entirely from the engine's bounded synthetic loopback probes (missing or unsafe security headers, cookie flags, CORS, TRACE, technology disclosure, verbose error bodies); the Quarkus adapter supplies only the inputs those probes need — the live server port (resolved per scan by the same launch-mode-aware port supplier the HTTP Probe panel uses) and the quarkus.http.root-path context path. The Spring-specific inputs are deliberately neutral: the adapter reports an empty endpoint inventory (a non-zero mapping count would otherwise flag every Quarkus application as "spring-security-web is not present", a false positive), no Spring Security wiring, and an absent Spring/Actuator configuration snapshot, so the Spring-Security and Actuator-exposure checks stay correctly silent rather than misfiring. One honesty caveat: the OWASP coverage matrix copy is engine-owned and Spring-worded, so a category in which nothing fired (for example A07) renders a Spring-flavored PASS/REVIEW line even though no Spring-specific probe ran on Quarkus.
Vulnerabilities
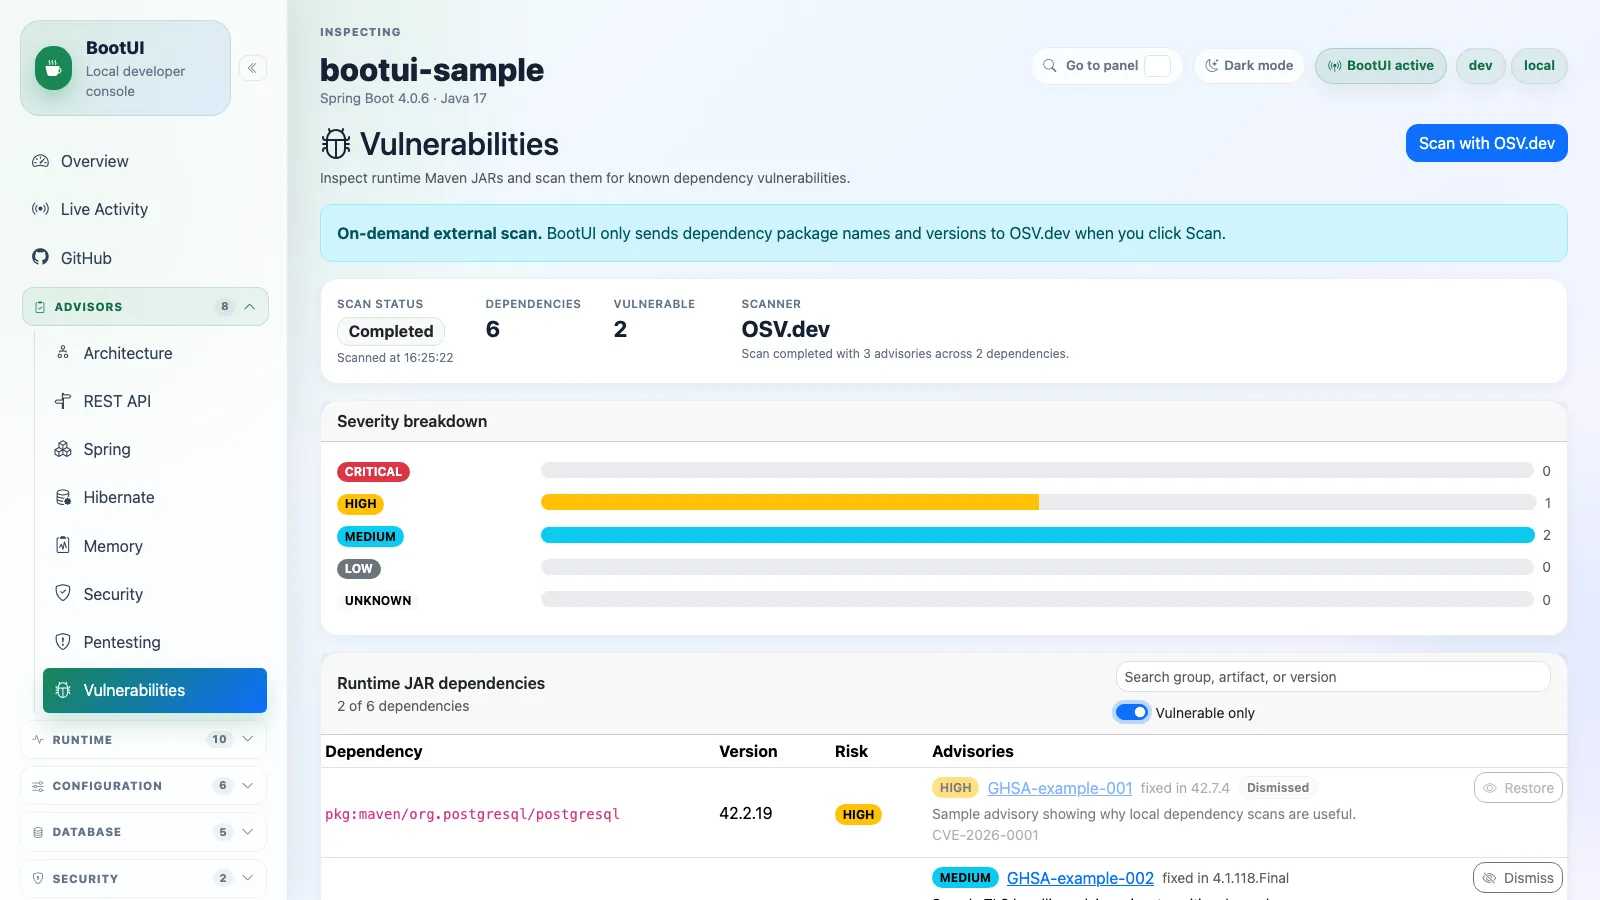
The Vulnerabilities panel shows dependency inventory and local OSV vulnerability scan results. It helps identify known vulnerable dependencies from the running project's dependency set during the local development loop. Scan findings are ordered by severity first (dismissed findings sink to the bottom regardless of severity), with dependencies and advisories alphabetized within the same severity.
Severity is derived from OSV.dev's severity[] entries, whose score field is a CVSS vector string for CVSS_V3/CVSS_V4 types (for example CVSS:3.1/AV:N/AC:L/PR:N/UI:N/S:U/C:H/I:H/A:H), never a bare number. Per the OSV schema, a package-level affected[].severity entry — when present for the specific dependency being scored — takes priority over the advisory's top-level severity[] (the schema states the two are mutually exclusive, and some advisories only carry severity at the package level), so the scanner looks there first before falling back to the top-level array. A CVSS v3.0/v3.1 vector (from either level) is parsed into a real numeric Base Score using the formula from the FIRST.org CVSS v3.1 specification; CVSS v4.0 has no closed-form Base Score equation (its MacroVector lookup table is a much larger undertaking), and BootUI's calculator is intentionally v3-specific rather than implementing the separate CVSS v2 formula, so both fall back to the advisory's database_specific.severity label (CRITICAL/HIGH/MODERATE/LOW, normalized to BootUI's MEDIUM label) when no v3 score is present at either level. An advisory with neither a parseable CVSS v3 score nor a database_specific label renders as UNKNOWN rather than being silently dropped. Advisories carrying a withdrawn timestamp are excluded from results entirely, since OSV does not filter withdrawn records out of its API responses itself. A single advisory detail fetch that fails (network hiccup, rate limiting) no longer aborts the whole scan: it is counted and the scan degrades to PARTIAL, keeping every advisory that did fetch successfully instead of discarding the whole result. Advisory detail fetches (GET /v1/vulns/{id}) run with a small bounded concurrency (up to 10 at a time) rather than one at a time, so a dependency tree with many distinct advisories no longer risks a scan taking up to maxAdvisories times the request timeout in a bad-network scenario; OSV.dev documents no rate limit for this endpoint.
OSV's /v1/querybatch endpoint paginates when an individual query matches more than 1,000 vulnerabilities or the whole batch exceeds 3,000 total, returning a next_page_token per affected query. The scanner follows that token with follow-up /v1/querybatch calls, merging every page back into one result set, bounded by a fixed page-count safety limit so a pathological advisory can't loop the scan forever (degrading to PARTIAL if the bound is hit before pagination is exhausted, rather than silently truncating). Independently, OSV also enforces a hard limit of 1,000 queries per /v1/querybatch request; the scanner partitions the (already max-packages-bounded) package list into batches of at most 1,000 before querying, so configuring max-packages above 1,000 no longer causes OSV to reject the whole batch with an HTTP 400.
Each advisory whose aliases includes a CVE-* id is additionally enriched with EPSS (Exploit Prediction Scoring System) data from FIRST.org's free, unauthenticated API — one batched GET /data/v1/epss?cve=... request per scan, alongside the OSV calls, following the same "network call only on the user-initiated scan action" pattern. EPSS reports the modeled probability that a CVE will be exploited in the wild in the next 30 days, plus the percentile that probability ranks against every other scored CVE — a likelihood-of-exploitation signal that deliberately complements (rather than replaces) CVSS's severity-if-exploited score, and is rendered as a secondary badge next to the severity/CVSS badge (for example "2.3% EPSS", with a tooltip spelling out the percentile). EPSS lookups can be disabled independently of OSV scanning via bootui.vulnerabilities.epss-enabled=false, and a failed or unreachable EPSS request never fails the scan or discards the OSV results — it simply omits the badge for that scan.
Each advisory also carries a derived fixAvailable boolean, computed by comparing the dependency's currently-resolved version against the advisory's fixedVersions with Maven ComparableVersion qualifier ordering, including alpha/beta/milestone/RC/SNAPSHOT/release/service-pack semantics. This lets the UI distinguish a genuine upgrade target ("fixed in x.y.z") from a dependency already at or above every fixed version OSV reported. When OSV reports no fixed event, the UI says only "No fixed version reported by OSV": under the OSV 1.8 schema a range may instead close with a mutually exclusive last_affected event, which identifies the final vulnerable version without naming the first non-vulnerable version, so absence of fixedVersions is not proof that no fix exists.
Like every other advisor, a vulnerability can be dismissed when it does not apply to your project (already patched downstream, accepted risk, or a fix not yet available upstream) — see the shared dismiss/restore explanation at the top of this section. The one difference from a flat rule-based advisor is the dismissal key's shape: because a vulnerability is scoped to one dependency, it is keyed by <vulnerability id>::<package name> (for example GHSA-xxxx-xxxx-xxxx::org.example:sample) rather than a bare rule id, so dismissing a finding for one dependency never accidentally hides the same advisory id reported against a different dependency, and a dismissal survives a patch-version bump of the still-vulnerable dependency. Dismissed vulnerabilities stay visible (dimmed, with a Restore button) rather than disappearing, and are excluded from the per-dependency and panel-level vulnerable counts.
On Quarkus the panel is identical, listing the local inventory first and contacting OSV.dev only on the user-initiated scan, over the same report contract, the same CVSS/withdrawn/partial-failure handling, the same pagination/batch- chunking, the same EPSS enrichment, and the same dismiss/restore workflow. The one platform difference is dependency discovery: the Spring adapter scans the classpath for META-INF/maven/*/pom.properties, which is unreliable under the Quarkus runtime classloader. For JARs without embedded metadata, Spring also reads an adjacent Maven POM (including in nonstandard local-repository paths), and only falls back to path-derived coordinates when a literal repository directory makes the group path unambiguous; it never guesses a group id from an arbitrary cache path. The Quarkus inventory is captured at build time from the application's resolved runtime dependency model and read back at runtime (mirroring the Architecture panel's build-time base-package discovery). The OSV and EPSS lookups are identical, and bootui.vulnerabilities.osv-enabled=false / bootui.vulnerabilities.epss-enabled=false disable on-demand scanning / EPSS enrichment on both adapters.
Two known limitations, documented honestly rather than hidden: the dependency inventory on both adapters is coordinate-based (one resolved JAR = one Maven groupId:artifactId:version), so a vulnerable library that has been relocated or repackaged inside a shaded/uber JAR carries no pom.properties/build-time coordinate of its own and is invisible to the inventory — the same reduced-fidelity honesty precedent already applied to other panels (for example Cache, Beans). And direct-vs-transitive dependency provenance ("introduced through") is not yet tracked on either adapter: Quarkus could source it from its existing build-time application dependency graph, but Spring's classpath-based inventory has no equivalent dependency graph today (adding one would need POM/Maven-plugin integration, a much larger change), so this is deferred rather than shipped as a Quarkus-only asymmetry for now.
Runtime
Health
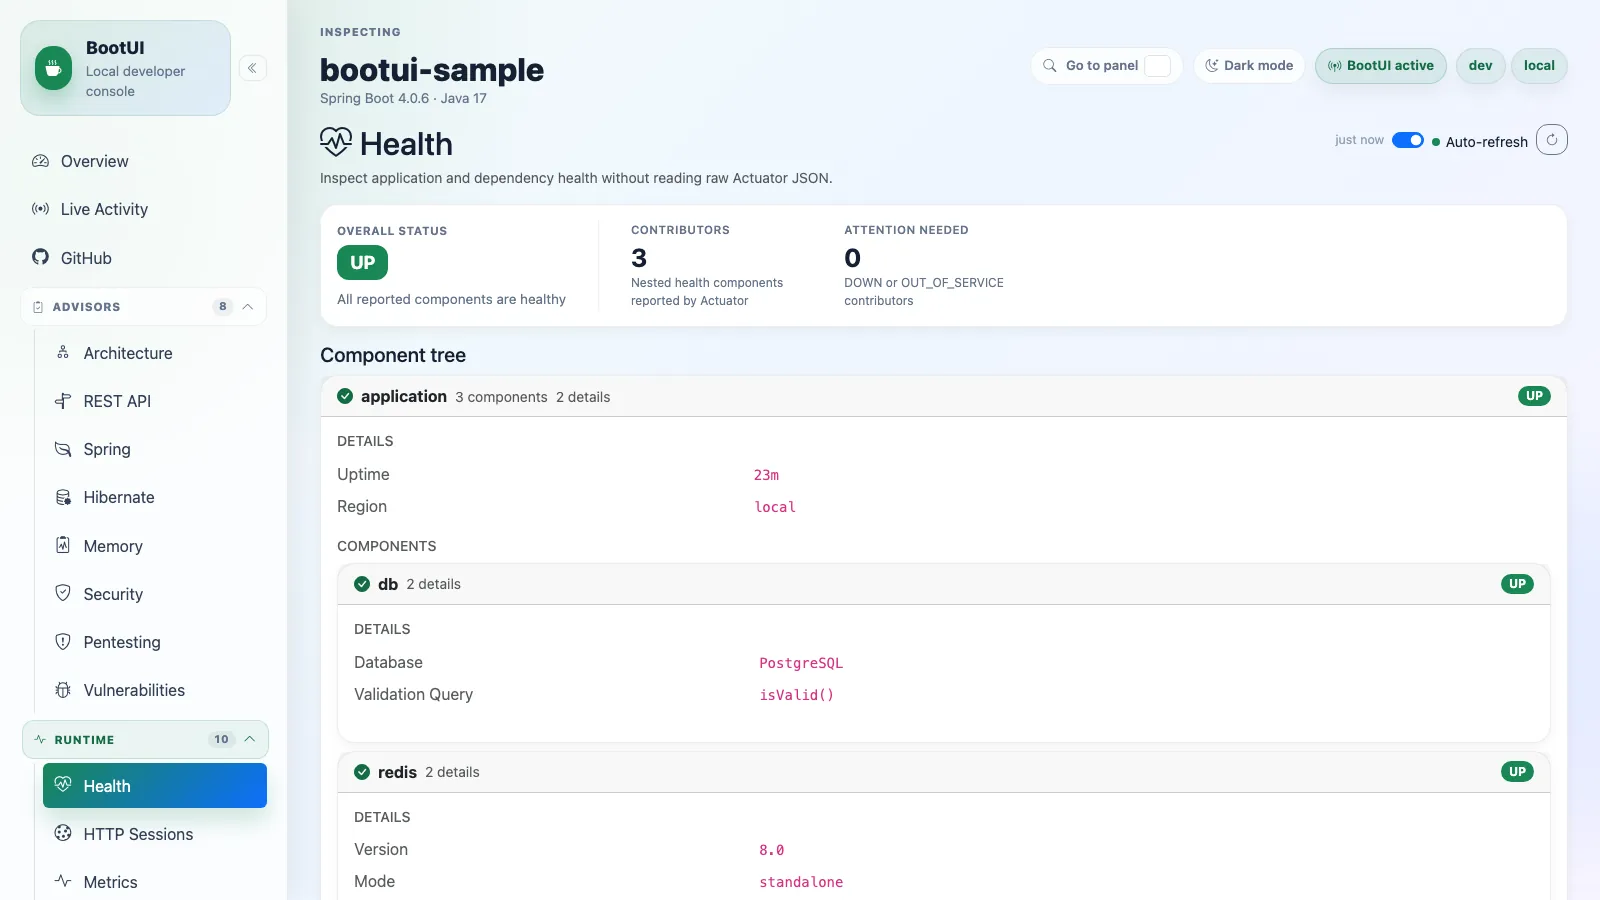
The Health panel displays the Actuator health tree, including nested contributors and detailed status information when the host app exposes it. It keeps unavailable health data separate from unhealthy application state so missing Actuator infrastructure is clear, and shows setup guidance instead of a healthy-looking status when the Actuator health endpoint is not available. When Actuator health is present but only Spring Boot's default indicators are reported, it keeps the live statuses visible and shows guidance for adding application or dependency health contributors.
On Quarkus the panel is identical, served over SmallRye Health (the MicroProfile Health implementation Quarkus uses): it reads the aggregated liveness and readiness report in-process and maps each check onto the same neutral status tree, with every check's reported data shown as nested details. When quarkus-smallrye-health is absent the panel stays visible and shows setup guidance for adding it instead of a healthy-looking status. SmallRye has no fixed framework-default contributors — every check is application-authored — so the Spring-only "default indicators only" guidance does not apply on Quarkus.
HTTP Sessions
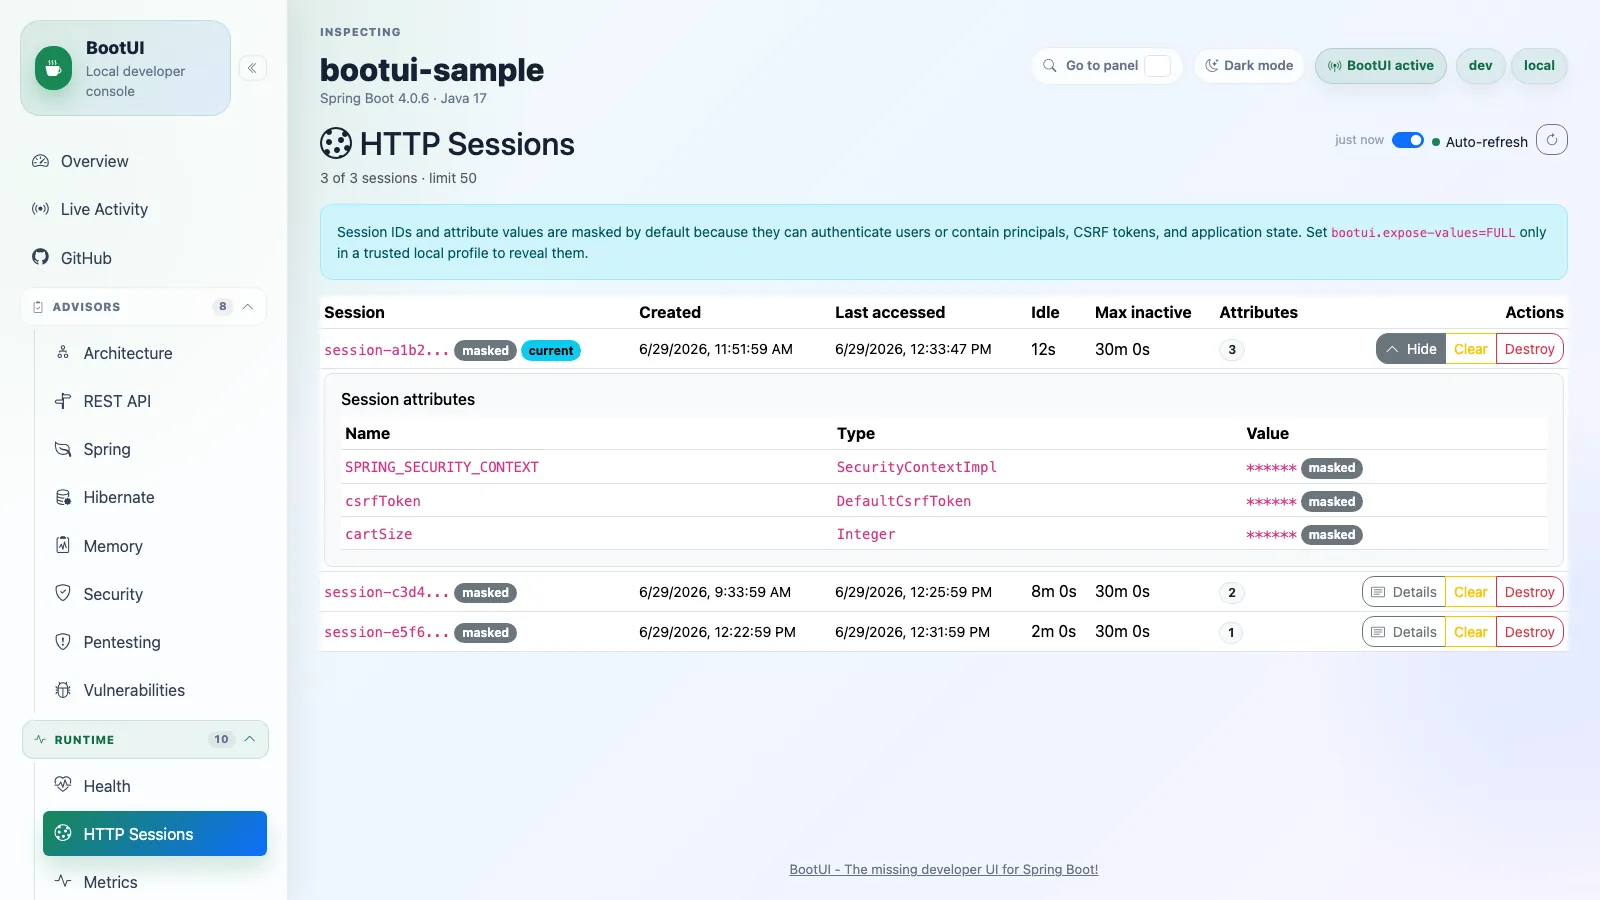
The HTTP Sessions panel lists local embedded Tomcat sessions with creation time, last access time, idle duration, attribute count, and current-session highlighting. Session identifiers are treated as bearer credentials: by default the UI only receives an opaque action key and a masked display id, and every attribute value is masked. Setting bootui.expose-values=FULL reveals display ids and stringified attribute values for local troubleshooting and shows an explicit FULL exposure warning, while METADATA_ONLY keeps attribute names and types without values. The panel returns at most 50 sessions by default; raise bootui.http-sessions.max-sessions if a local app needs a larger bounded view.
Clear and destroy actions are confirmation-gated and disabled by global or per-panel read-only mode. Clear removes all attributes from the selected session while keeping it valid; destroy invalidates the selected session. When the app is not running on embedded Tomcat, the panel shows an unavailable state instead of guessing at container internals.
This panel is deliberately not applicable on Spring Boot WebFlux: HTTP Sessions are the servlet container's HttpSession API, which has no reactive equivalent (WebSession is a different, non-container-managed model), so the panel reports an honest "not applicable" reason rather than implying a port is forthcoming — the same treatment GraalVM/CRaC get on Quarkus.
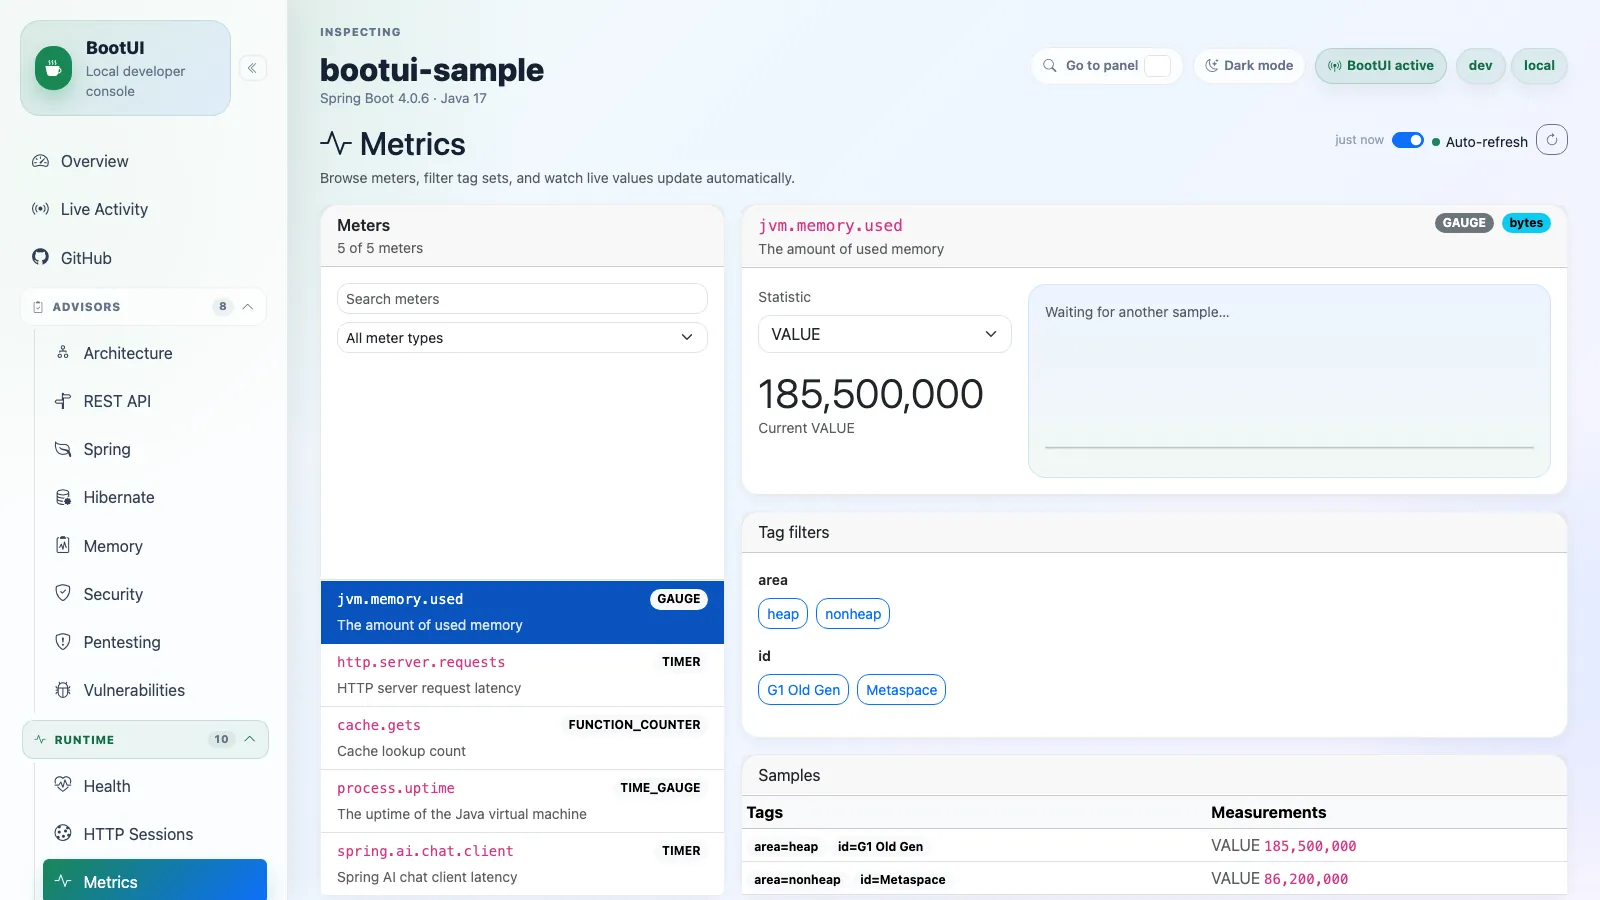
Metrics
The Metrics panel browses Micrometer meters exposed by Actuator. You can inspect meter descriptions, base units, tags, available measurements, and render a local live chart for a selected metric/tag combination.
On Quarkus the panel is identical, served over Micrometer directly (Quarkus has no Actuator): it reads the live composite MeterRegistry when the application adds a quarkus-micrometer registry (for example quarkus-micrometer-registry-prometheus), and otherwise renders as unavailable while staying in the sidebar. As on Spring Boot, meters describing BootUI's own /bootui/** traffic are hidden so the console never reports on itself.
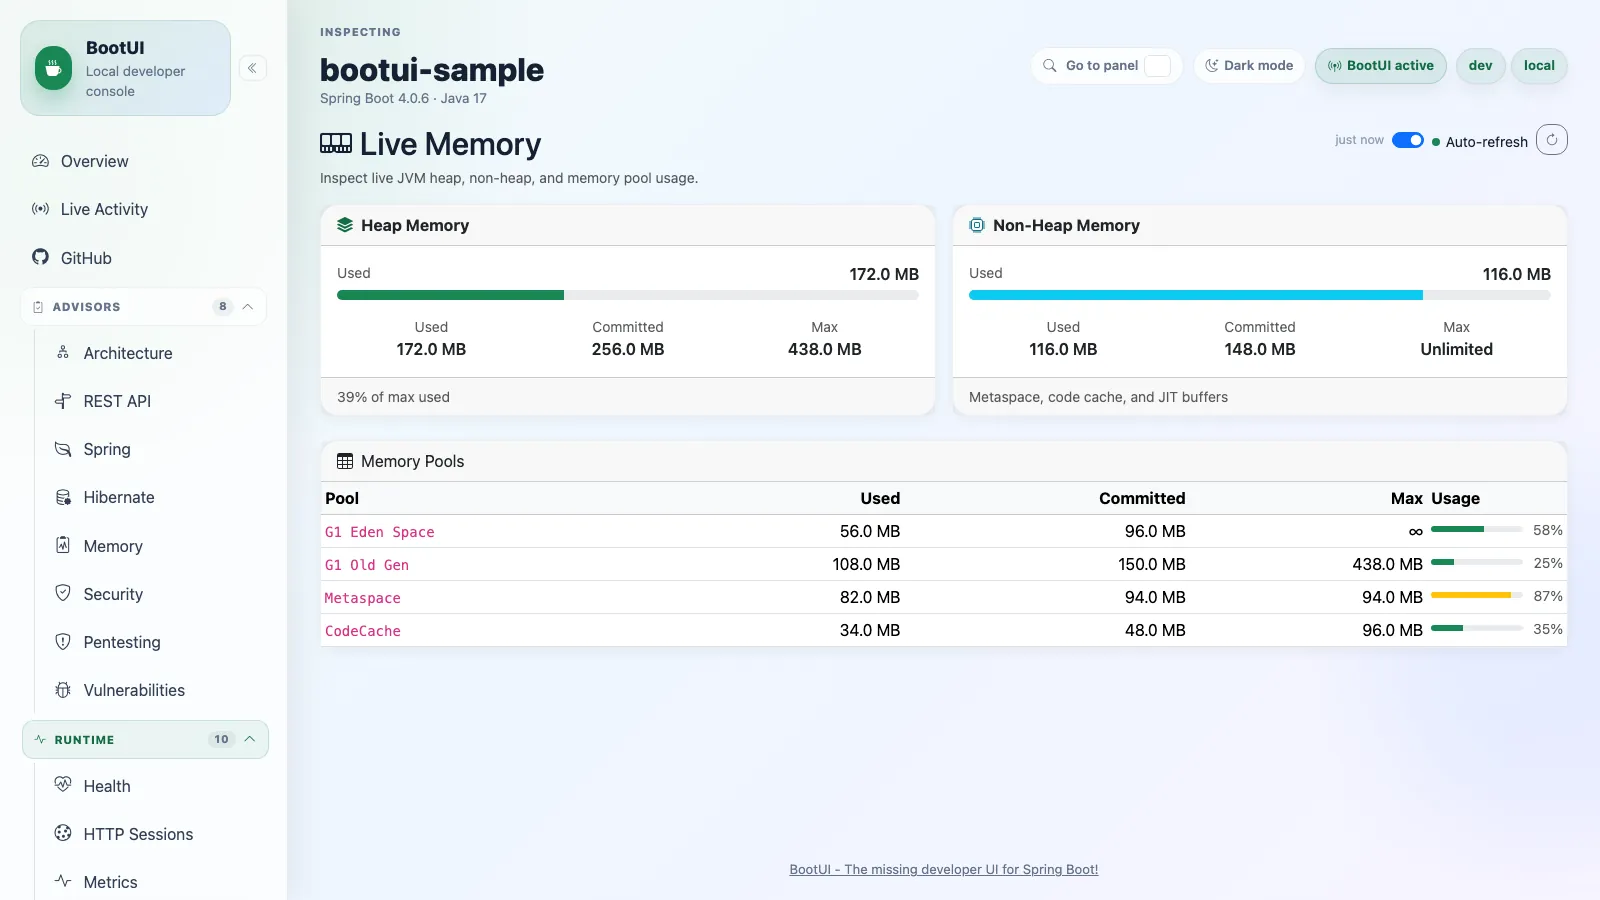
Live Memory
The Live Memory panel summarizes current live JVM heap and non-heap usage plus memory pool utilization. It stays focused on the running process metrics so you can spot high heap pressure, non-heap growth, and pool-level saturation without the JVM sizing controls mixed into the view.
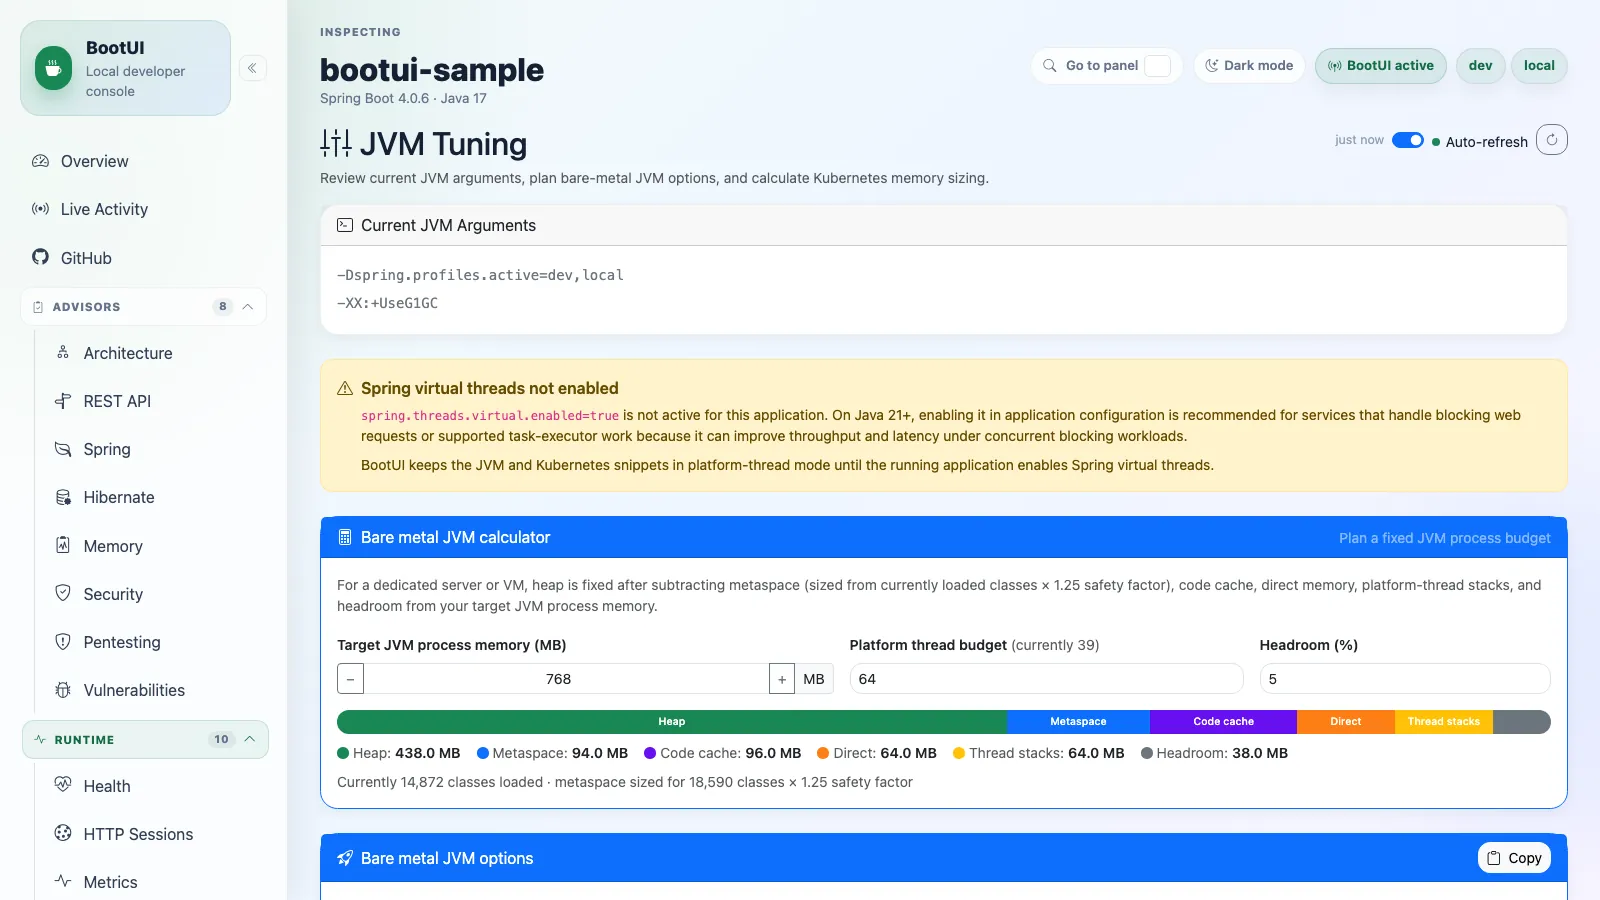
JVM Tuning
The JVM Tuning panel uses the same live JVM context to review current JVM input arguments, explain spring.threads.virtual.enabled=true, and run JVM sizing calculators for both dedicated hosts and Kubernetes. It detects whether Spring virtual threads are enabled in the current application, shows an information or warning bubble, and feeds that detected state into platform-thread stack budgets and heap sizing recommendations without adding the Spring property to generated JVM or Kubernetes snippets.
The bare-metal calculator partitions a target JVM process memory budget into heap, metaspace, code cache, direct memory, thread stacks, and headroom, then turns that plan into copyable JVM options with fixed -Xms and -Xmx values. The Kubernetes calculator keeps requests.memory == limits.memory for Guaranteed QoS by default, but can switch to a snapshot-based Burstable request when the operator intentionally overcommits memory. Its JAVA_TOOL_OPTIONS uses -XX:MaxRAMPercentage and -XX:InitialRAMPercentage instead of fixed heap sizes so the JVM heap follows the container memory limit when an operator resizes the pod. A Kubernetes health probes toggle initializes from the current health probe configuration and, when enabled, adds startup/readiness/liveness probe YAML plus the health-probes property. Fixed non-heap caps remain visible in the snippet and sizing notes because they still need to fit inside any smaller limit.
Not available in GraalVM native images. JVM heap, GC, and flag tuning does not apply to a native executable; the panel is automatically hidden when the application is detected to be running as a native image.
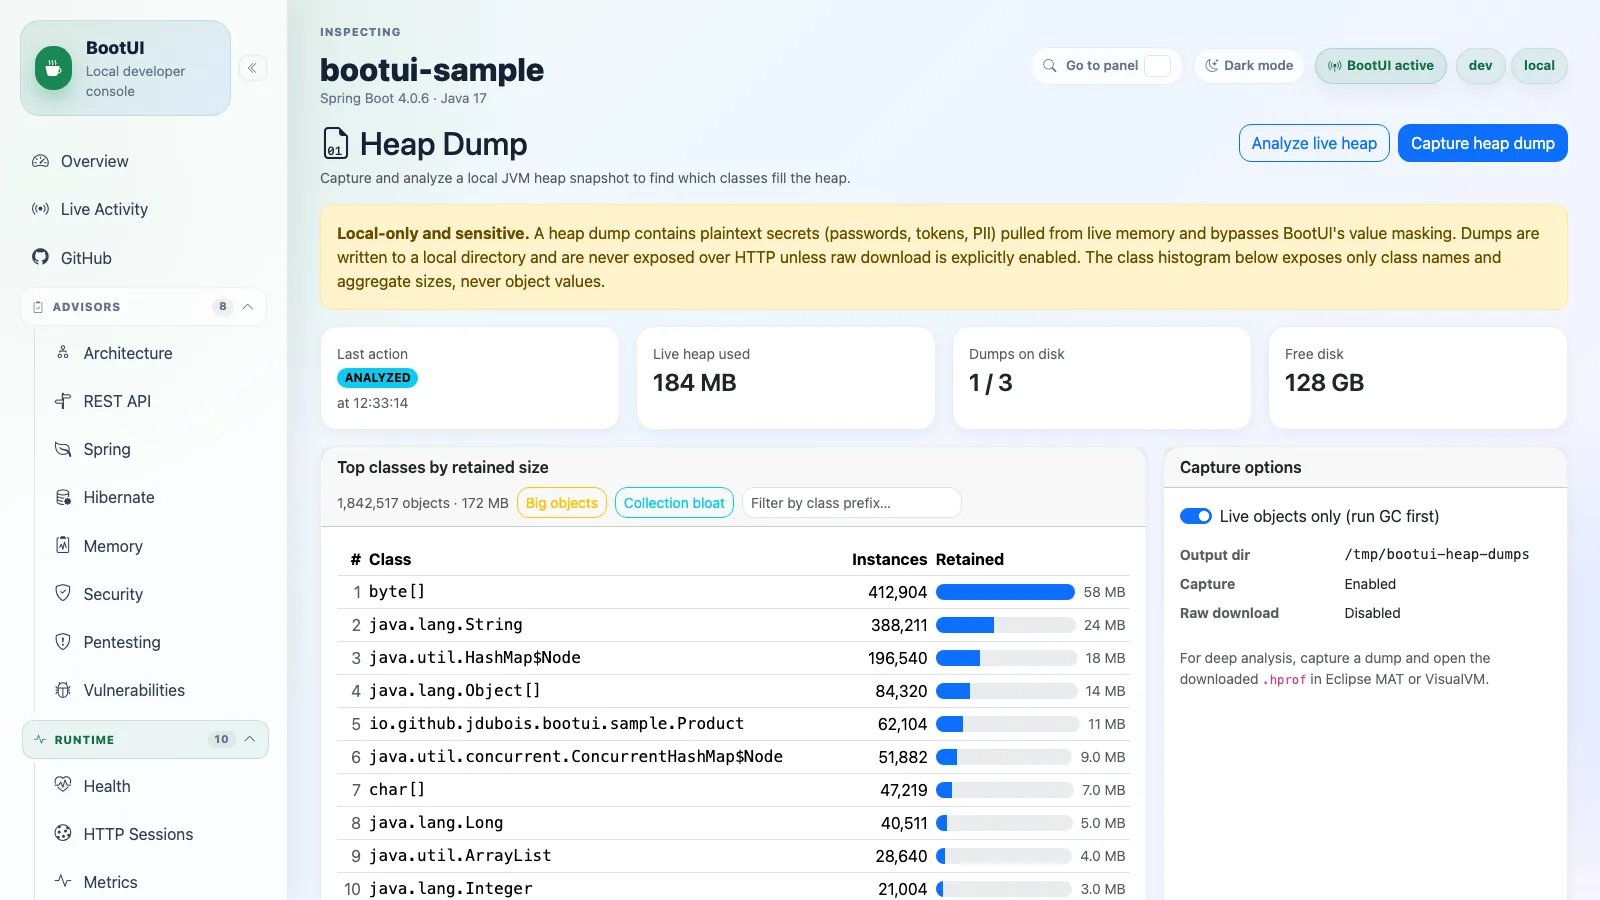
Heap Dump
The Heap Dump panel captures local JVM heap dumps on demand and analyzes them through a value-free class histogram, so you can investigate suspected memory leaks or unexpected retention during the local development loop. Capture and analyze actions run an explicit, confirmed request that triggers a full GC and writes an .hprof file under the configured output directory; the panel then shows live heap usage, the top retaining classes by instance count and shallow size, and the list of captured dumps with retention-based eviction.
Heap dumps can contain plaintext secrets, credentials, and personal data, so the panel is designed to be safe by default: it only summarizes class names and sizes (never object values), all capture/analyze/delete operations are mutating POST requests that are blocked when the panel is read-only, and downloading the raw .hprof file is disabled unless explicitly enabled via configuration. Use it on a local JVM only, and treat any exported dump as sensitive.
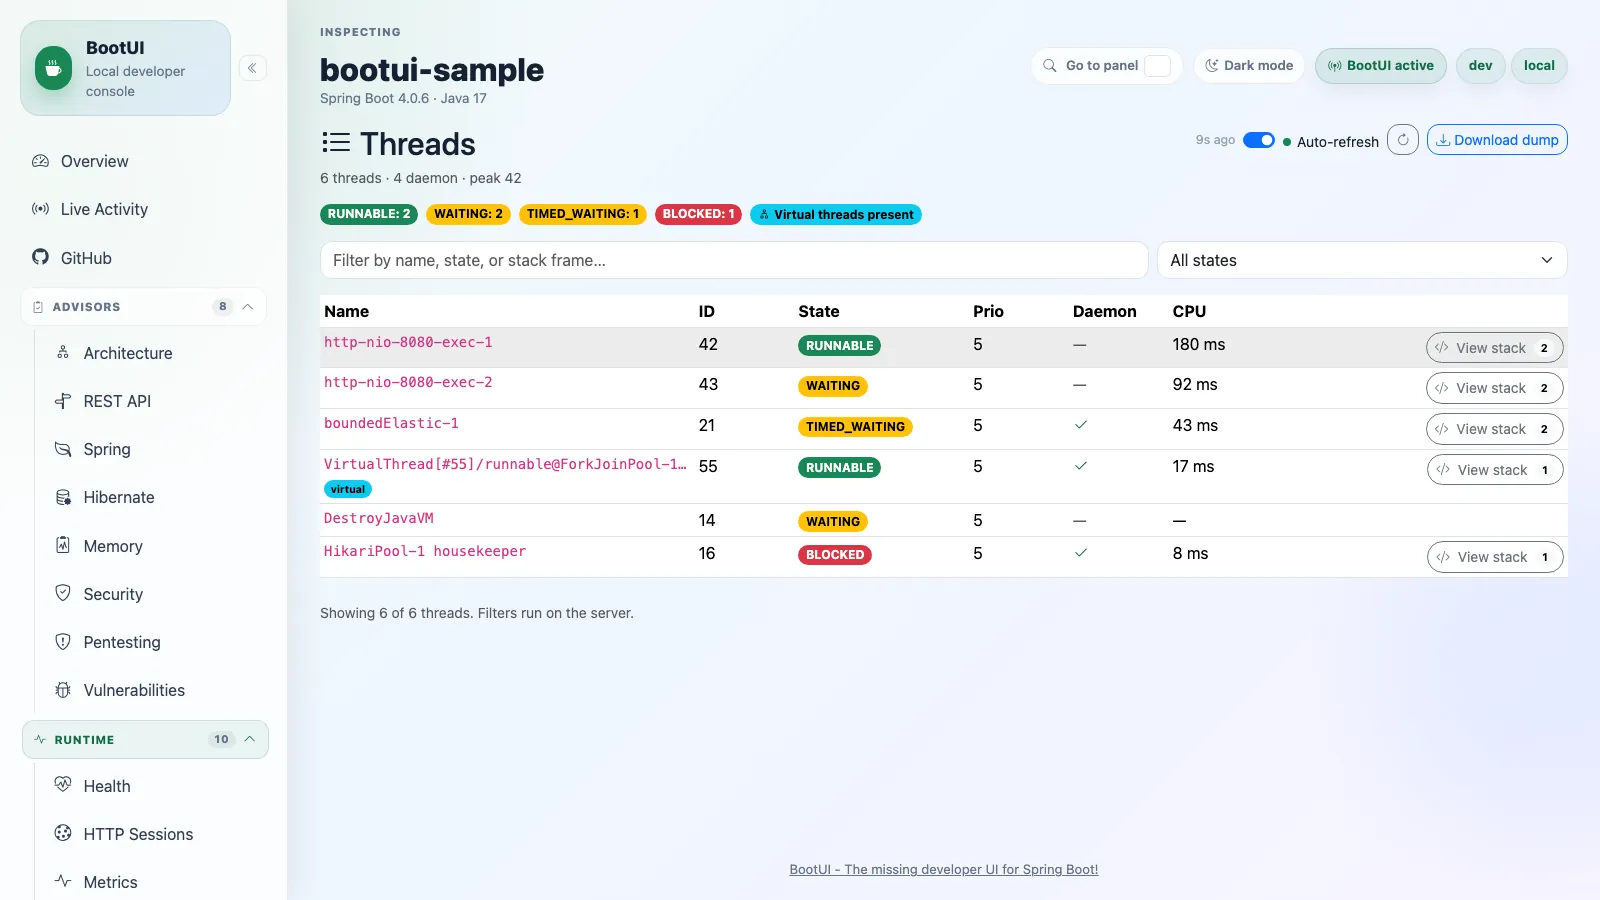
Threads
The Threads panel shows a live snapshot of the JVM's threads so you can answer "what is the application doing right now?" during local development. It reads thread information in-process through ThreadMXBean rather than requiring the host application to expose the Actuator threaddump endpoint, and presents a state summary header (counts per thread state), a flag when a deadlock is detected, and virtual-thread context when running on a JDK that supports it. The thread list supports server-side filtering by name and by state with paging, and each row can expand to show its stack trace.
Stack frames and thread names can incidentally contain sensitive values, so the panel reuses BootUI's masking and value-exposure model: names are masked when they look like secrets, and stack traces are omitted entirely under metadata-only exposure. The raw text thread dump is offered as a confirmation-gated POST download that is blocked when the panel is read-only. The panel stays loopback-only and fails closed, showing an explained unavailable state instead of disappearing when thread information cannot be read.
Startup Timeline
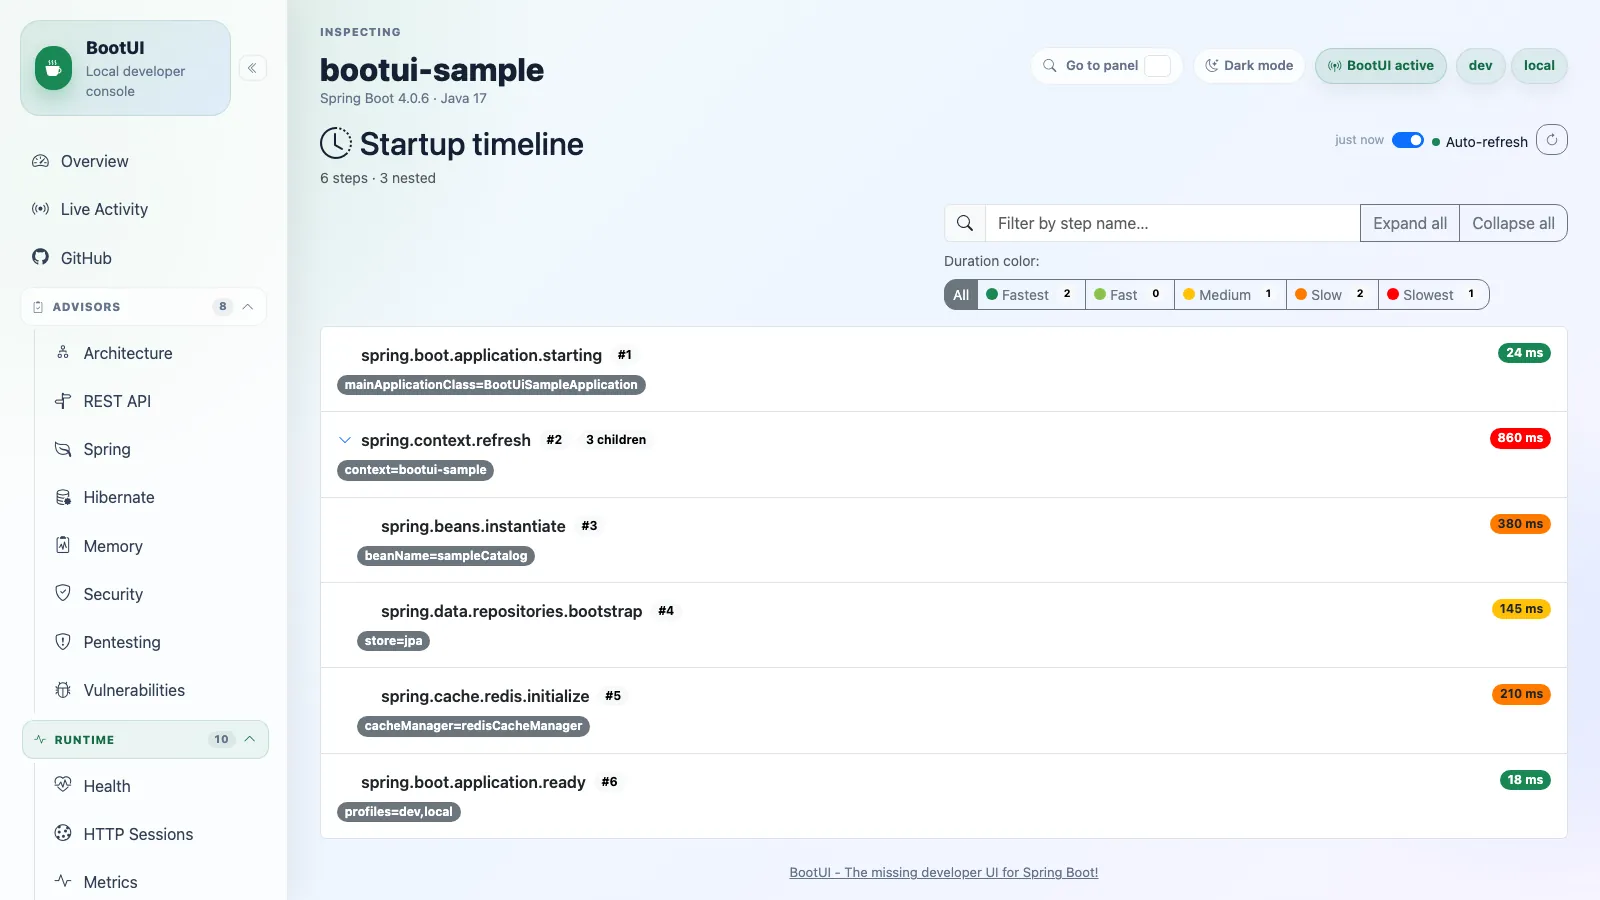
The Startup Timeline panel visualizes Spring Boot startup steps from Actuator startup data. It helps identify expensive startup phases, slow bean initialization, and the overall application startup shape. When BootUI is active, the starter installs a BufferingApplicationStartup by default so the panel has data without host-app setup; disable that with bootui.startup.enabled=false or tune the retained step count with bootui.startup.capacity. If startup data is still unavailable, the panel shows an empty state instead of failing.
GraalVM
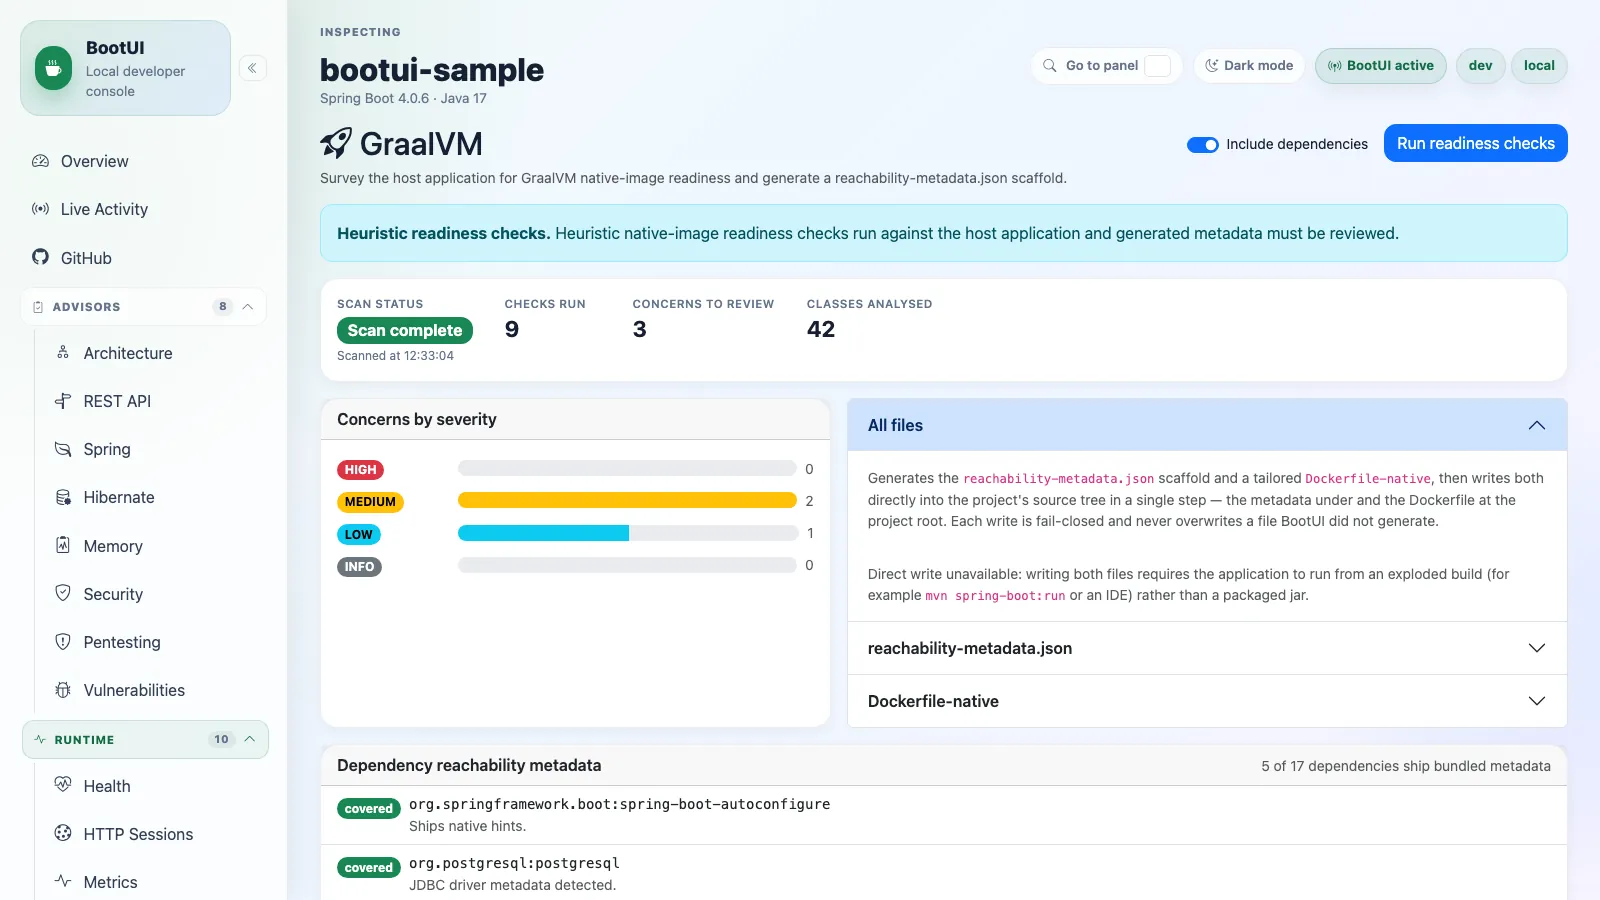
The GraalVM panel surveys the host application for GraalVM native-image readiness. On demand it imports the application's own classes (bounded to the detected base package(s)) and runs a curated set of heuristic checks for constructs that native-image cannot resolve at build time — reflection, dynamic class loading, deep reflection, dynamic proxies, runtime resource loading, resource bundles, service loading, serialization, build-time-initialization side effects, and native access. With the Include dependencies toggle on (it is on by default), it also surveys the classpath to report which third-party libraries already ship reachability metadata under META-INF/native-image/, and — for libraries that do not — looks up Oracle's GraalVM reachability metadata repository to show whether the detected dependency version is covered, only partial (the repository has metadata for a different version), or has none, with links to the matching repository entry and metadata file. That repository lookup is the panel's only outbound network call; it is user-initiated, time-bounded, and can be disabled with bootui.graalvm.repository-lookup-enabled=false. Long dependency lookups report progress and can be aborted from the panel. From the same scan the panel generates a downloadable reachability-metadata.json scaffold (modern unified schema, with condition.typeReached guards) seeded with reflection/serialization candidates and the standard configuration resource globs. When BootUI detects the application is running from an exploded build (for example mvn spring-boot:run or an IDE) rather than a packaged jar, the panel also offers a Write into project action that writes the same scaffold directly to src/main/resources/META-INF/native-image/<groupId>/<artifactId>/reachability-metadata.json (resolving coordinates from build-info.properties or the project pom.xml, falling back to a bootui-generated namespace). The install is fail-closed: it is confined under src/main/resources and never overwrites a reachability-metadata.json that BootUI did not generate. Alongside the metadata scaffold the panel also generates a tailored, multi-stage Dockerfile-native that builds a GraalVM native image of the host application. It detects the project's build system — Maven or Gradle, with or without the wrapper — and uses the matching native build command (./mvnw/mvn -Pnative -DskipTests clean native:compile, or ./gradlew/gradle nativeCompile), then packages the resulting executable — named after the resolved artifactId — into a minimal, distroless runtime image (gcr.io/distroless/base-debian12:nonroot, which runs as a non-root user and carries no shell/curl/perl/tar, keeping the OS-package CVE surface near zero; the binary is built mostly static so it needs only glibc, and the build stage installs a known, pinned Maven/Gradle release when the project has no wrapper). It can be downloaded, or written directly to the project root under the same exploded-build constraint and the same fail-closed guard (BootUI never overwrites a Dockerfile-native it did not generate). The metadata scaffold and the Dockerfile-native are presented in a three-drawer accordion whose default, top drawer is an All files action that generates and writes both artifacts into the project's source tree in a single step (under the same exploded-build constraint and fail-closed guards), reporting each file's outcome. After a scan, the concerns list can be filtered in place by severity, category, or free-text search to focus on a subset of findings without rerunning the scan. The checks and generated metadata are heuristic review aids that complement, but do not replace, the GraalVM tracing agent and an actual native build. See GRAALVM-READINESS-CHECKS.md for the full catalogue of checks and what each one inspects.
Not available when already running as a GraalVM native image. The readiness advisor scans compiled
.classfiles to help you prepare an application for native-image compilation; once the application is already running as a native executable the advisor has no purpose, and the panel is automatically hidden.
This panel is Spring Boot only and is deliberately not applicable on Quarkus. Quarkus compiles native images itself (quarkus build -Dnative / the native build profile) and generates its own reachability metadata at build time through its build-time augmentation, so a Spring-oriented native-readiness advisor — and the generic reachability-metadata.json and Dockerfile-native it scaffolds — would not match how Quarkus produces native images. The panel therefore reports an honest "not applicable on Quarkus" reason rather than implying a port is forthcoming.
CRaC
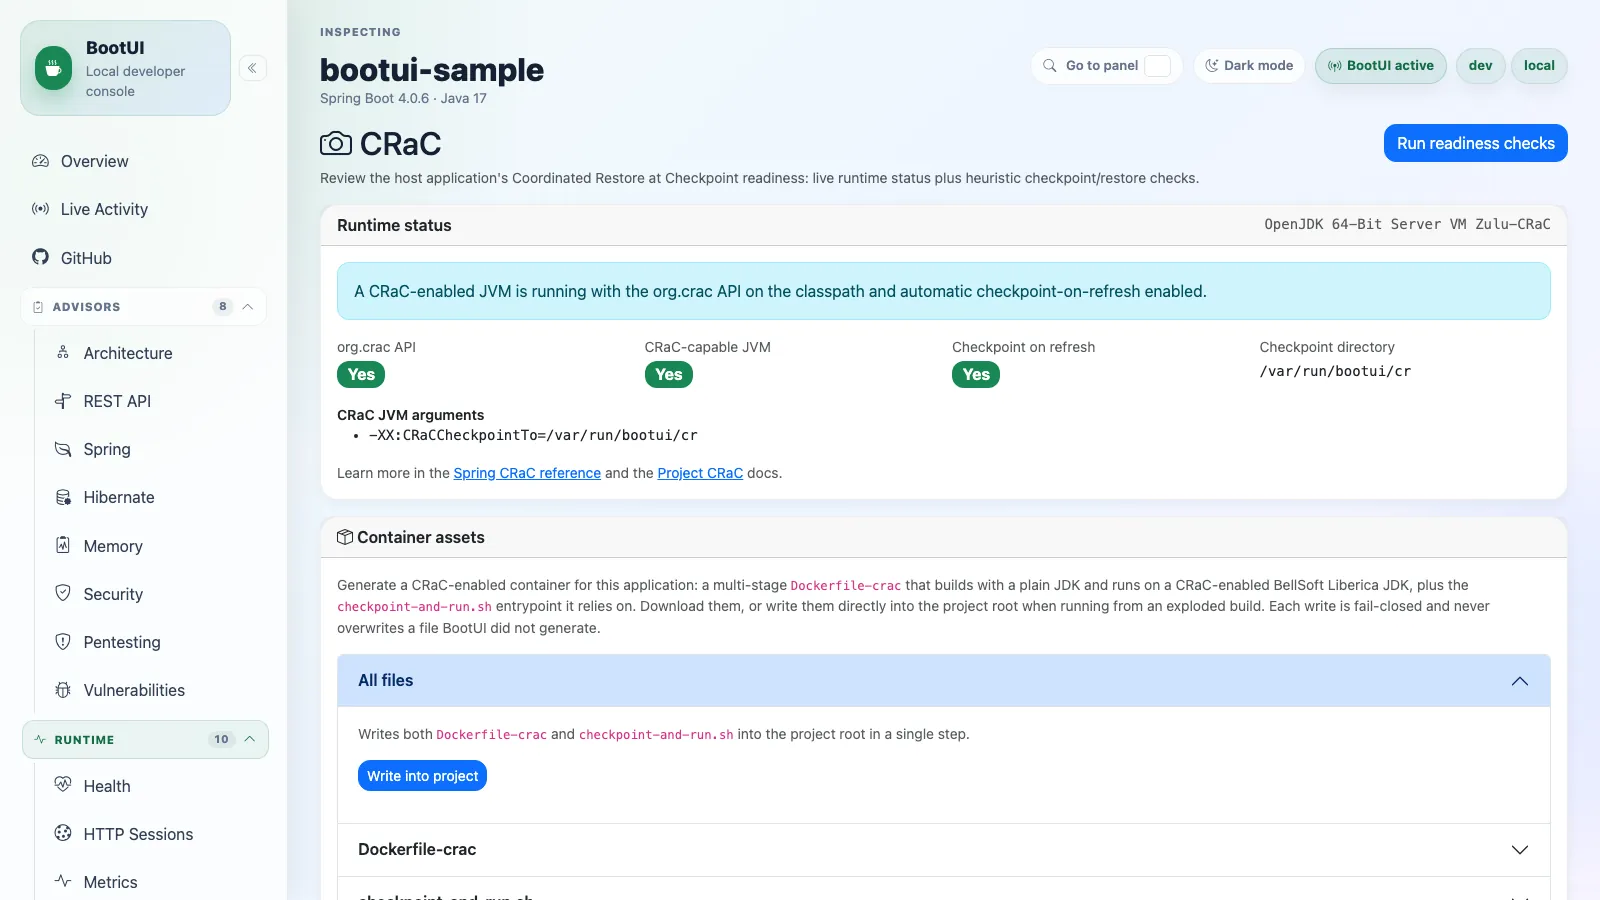
The CRaC panel reviews the host application's Coordinated Restore at Checkpoint readiness, combining live runtime status with a heuristic readiness advisor. The runtime-status card (always read-only) reports whether the org.crac API is on the classpath, whether the running JVM is a CRaC-capable JDK (such as Azul Zulu CRaC or BellSoft Liberica, detected via the real CRaC implementation rather than the no-op shim), whether spring.context.checkpoint=onRefresh is set, and any -XX:CRaCCheckpointTo / -XX:CRaCRestoreFrom JVM arguments (read from the same RuntimeMXBean input arguments the JVM Tuning panel uses). On demand the readiness advisor imports the application's own classes (bounded to the detected base package(s)) and runs a curated set of CRaC-* checks for constructs that complicate checkpoint/restore — open resources and file handles held outside a managed CRaC/Spring lifecycle, network listeners (including NIO channels), live connection pools, cache managers, and HTTP/RPC clients, unmanaged threads and fixed-rate scheduled tasks that may run a catch-up burst after an on-demand restore, captured timestamps, captured environment/system configuration, Random/SecureRandom and secret state held in static or instance fields, and a missing org.crac.Resource registration or org.crac:crac dependency. After a scan, the concerns list can be filtered in place by severity, category, or free-text search to focus on a subset of findings without rerunning the scan. The checks are heuristic review aids that complement, but do not replace, an actual checkpoint/restore run on a CRaC-enabled JDK. See CRAC-READINESS-CHECKS.md for the full catalogue of checks and what each one inspects.
The panel also generates ready-to-use container assets for the host application: a multi-stage Dockerfile-crac that builds with a plain JDK and runs on a CRaC-enabled BellSoft Liberica JDK, plus the checkpoint-and-run.sh entrypoint it relies on (it takes a checkpoint on the first start via spring.context.checkpoint=onRefresh and restores it on later starts). The build command is tailored to the detected build system (Maven or Gradle, with or without the wrapper). Each file can be downloaded, and — when the application is running from an exploded build (for example mvn spring-boot:run or an IDE) rather than a packaged jar — written directly into the project root. Writes are fail-closed and never overwrite a file BootUI did not generate. This shares the same source-tree writer the GraalVM panel uses for its Dockerfile-native.
Not available in GraalVM native images. CRaC (Coordinated Restore at Checkpoint) is a JVM-only feature and is mutually exclusive with native executables; the panel is automatically hidden when the application is detected to be running as a native image.
This panel is Spring Boot only and is deliberately not applicable on Quarkus. The advisor and its generated assets target the Spring Boot startup model (spring.context.checkpoint=onRefresh and Spring's checkpoint/restore lifecycle), whereas Quarkus achieves fast startup through build-time augmentation and native images rather than CRaC checkpoint/ restore. The panel therefore reports an honest "not applicable on Quarkus" reason rather than implying a port is forthcoming.
Configuration
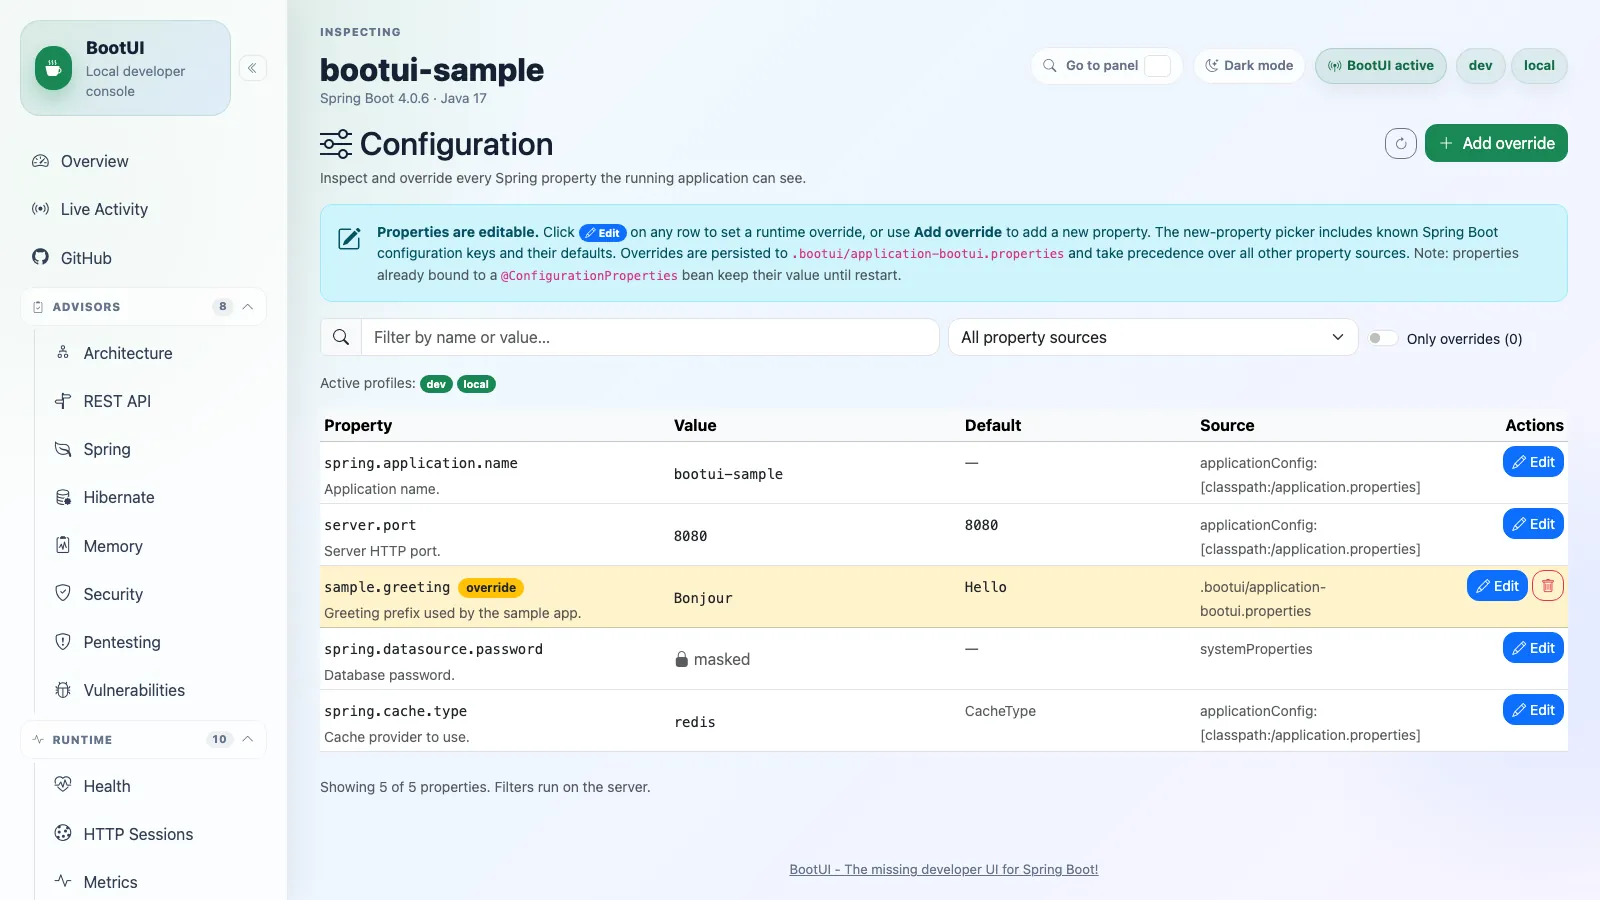
Configuration
The Configuration panel shows effective configuration properties, sources, metadata descriptions, defaults when known, active profiles, and masked values. It can create, update, and delete local runtime overrides persisted to .bootui/application-bootui.properties, with restart and rebinding caveats shown for every mutation. Large property tables load in bounded server-side pages for search, source, and override-only filters. The override property-name picker limits its datalist suggestions while narrowing against the full metadata catalog as you type.
Profile Diff
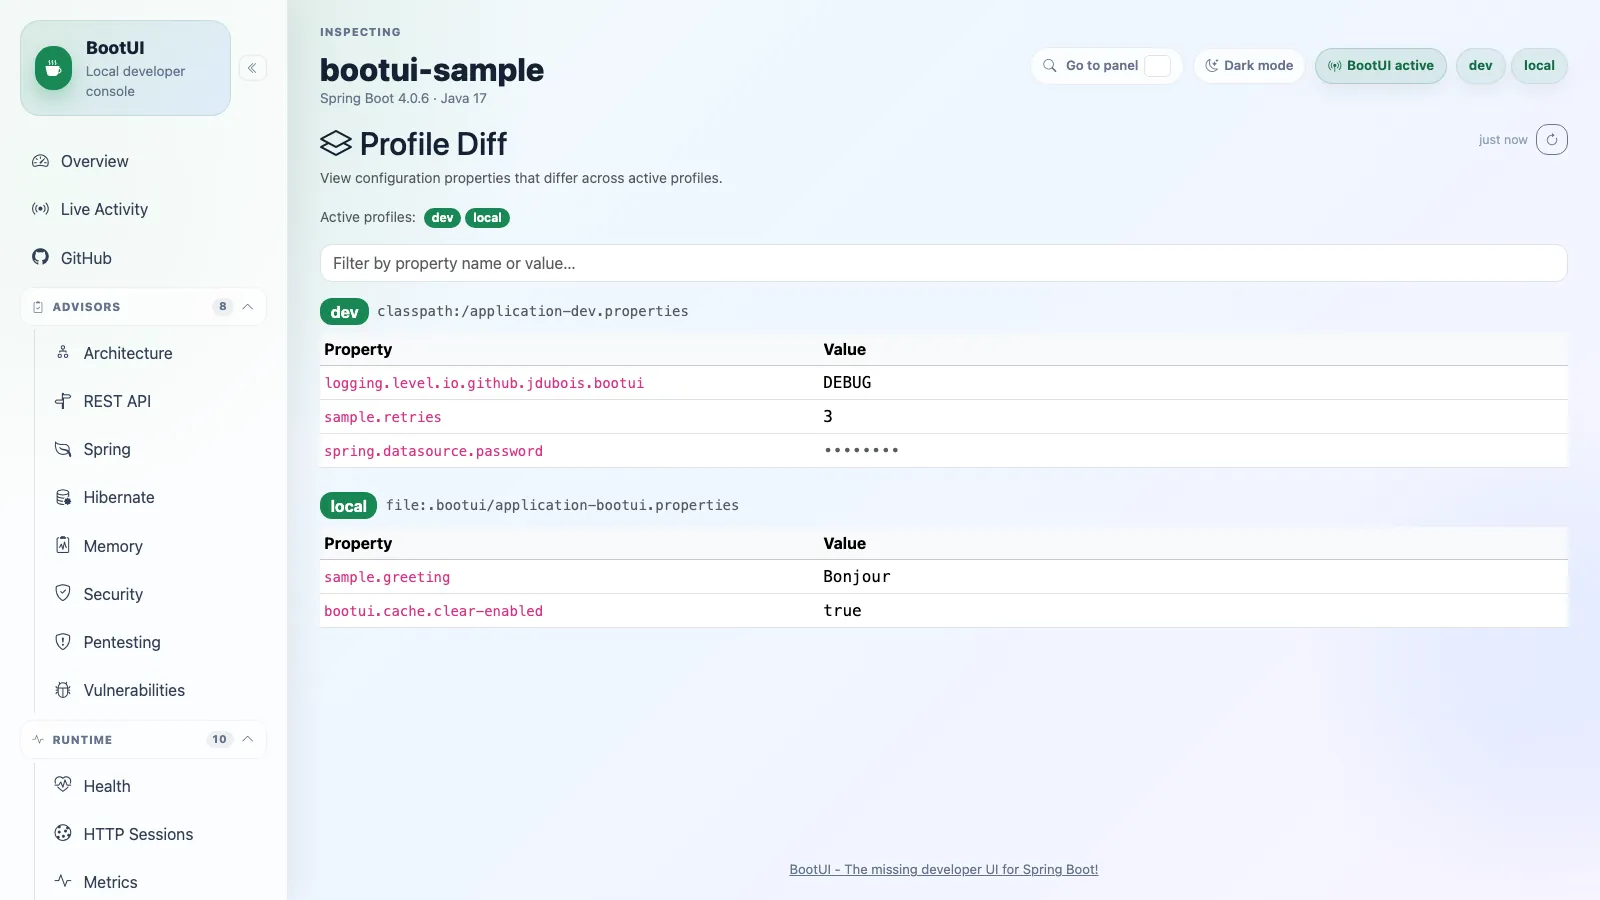
The Profile Diff panel compares profile-specific property sources and values. It is useful for understanding what changes between local development profiles while still routing browser-visible names and values through BootUI's secret masking rules.
Loggers
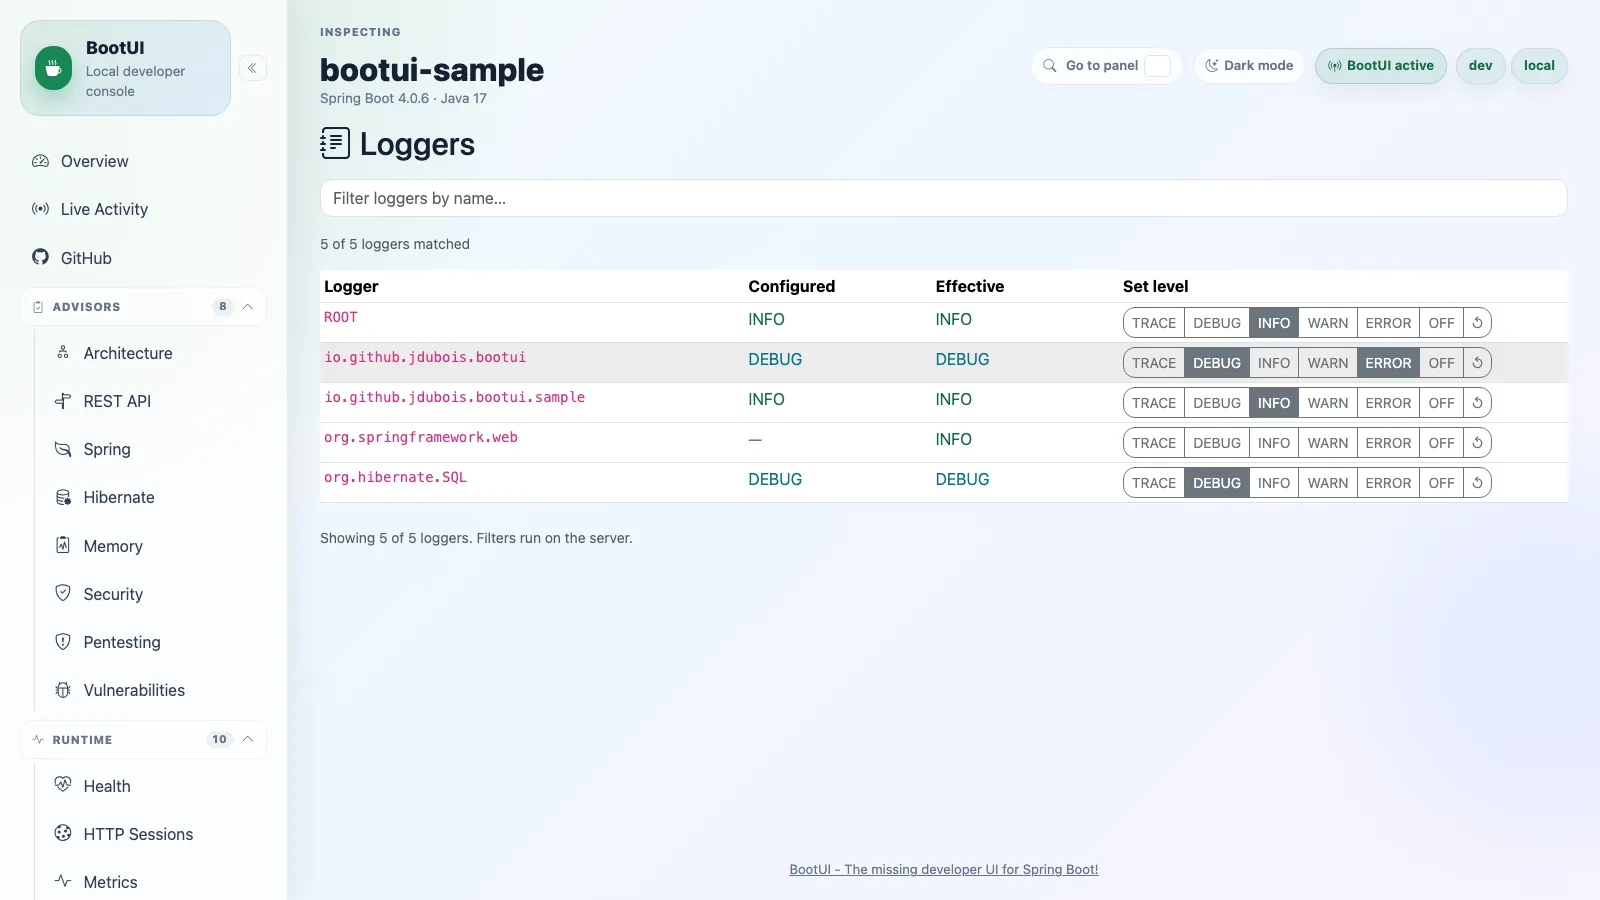
The Loggers panel lists runtime logger configuration. On Spring Boot it reads from Actuator's loggers endpoint. It shows configured and effective levels, supports server-side search, and can update or clear logger levels without restarting the application. Large logger lists load in bounded pages while filtering still searches the full logger set.
On Quarkus the panel is identical, served over the JBoss LogManager that Quarkus uses at runtime: it enumerates the live loggers, maps their levels onto the same canonical vocabulary (OFF, FATAL, ERROR, WARN, INFO, DEBUG, TRACE), and applies level changes to the running JVM. BootUI refuses to change the level of its own loggers on either platform.
Beans
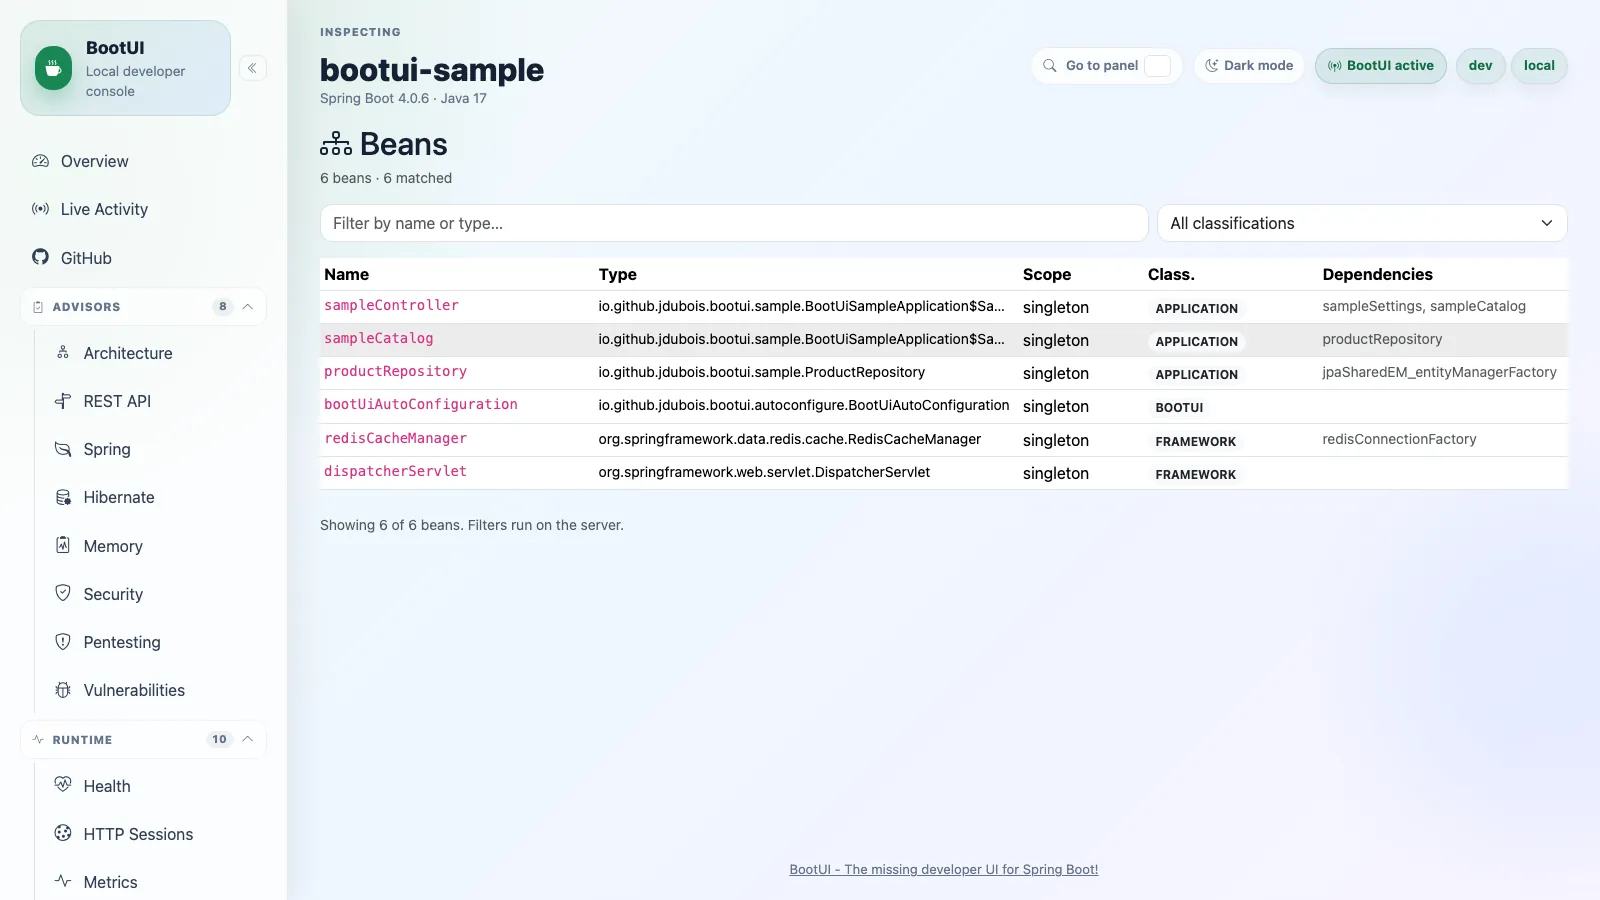
The Beans panel helps answer which Spring beans exist and where they came from. It supports server-side search across bean names and types, plus classifications such as application, Spring framework, Java/Jakarta, and other beans. BootUI's own beans are hidden by default; when self-data filtering is disabled they are classified separately as BootUI beans. Large bean lists load in bounded pages so the initial payload stays small while filters still apply to the full bean set.
On Quarkus the panel is identical from the UI's point of view, running over the same framework-neutral engine BeansService and the same /bootui/api/beans contract. The Quarkus adapter enumerates beans from the live Arc/CDI container (in place of the Spring adapter's Actuator beans endpoint), filters out BootUI's own beans, and classifies them with Quarkus-aware framework prefixes (io.quarkus., io.vertx., org.jboss., …). A few fields have reduced fidelity because Arc does not expose them at runtime the way Actuator does: the defining resource and inter-bean dependencies are empty, the scope uses the CDI vocabulary (ApplicationScoped, Singleton, …) rather than Spring's singleton/prototype, and unnamed beans get a synthetic decapitalized class name. The inventory also reflects only the beans Arc retains, since Arc removes unused beans at build time.
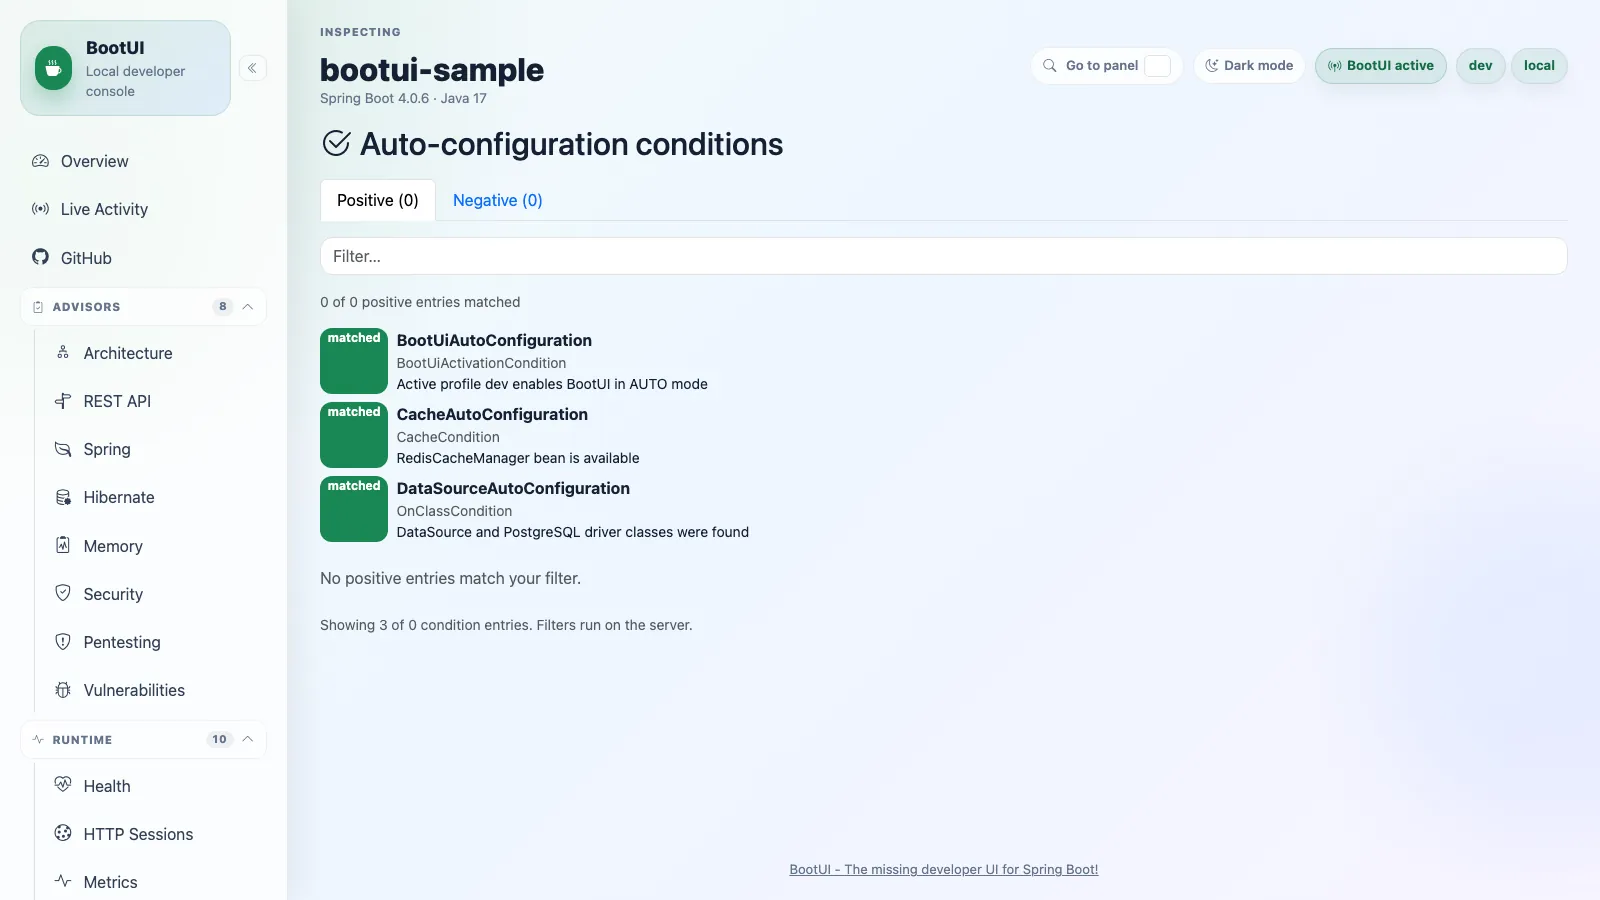
Conditions
The Conditions panel explains Spring Boot auto-configuration decisions. It groups positive matches, negative matches, and unconditional classes so you can see why an auto-configuration applied or why it was skipped. Large condition reports load in bounded pages, and filtering runs on the server so the browser does not need the full report before narrowing results.
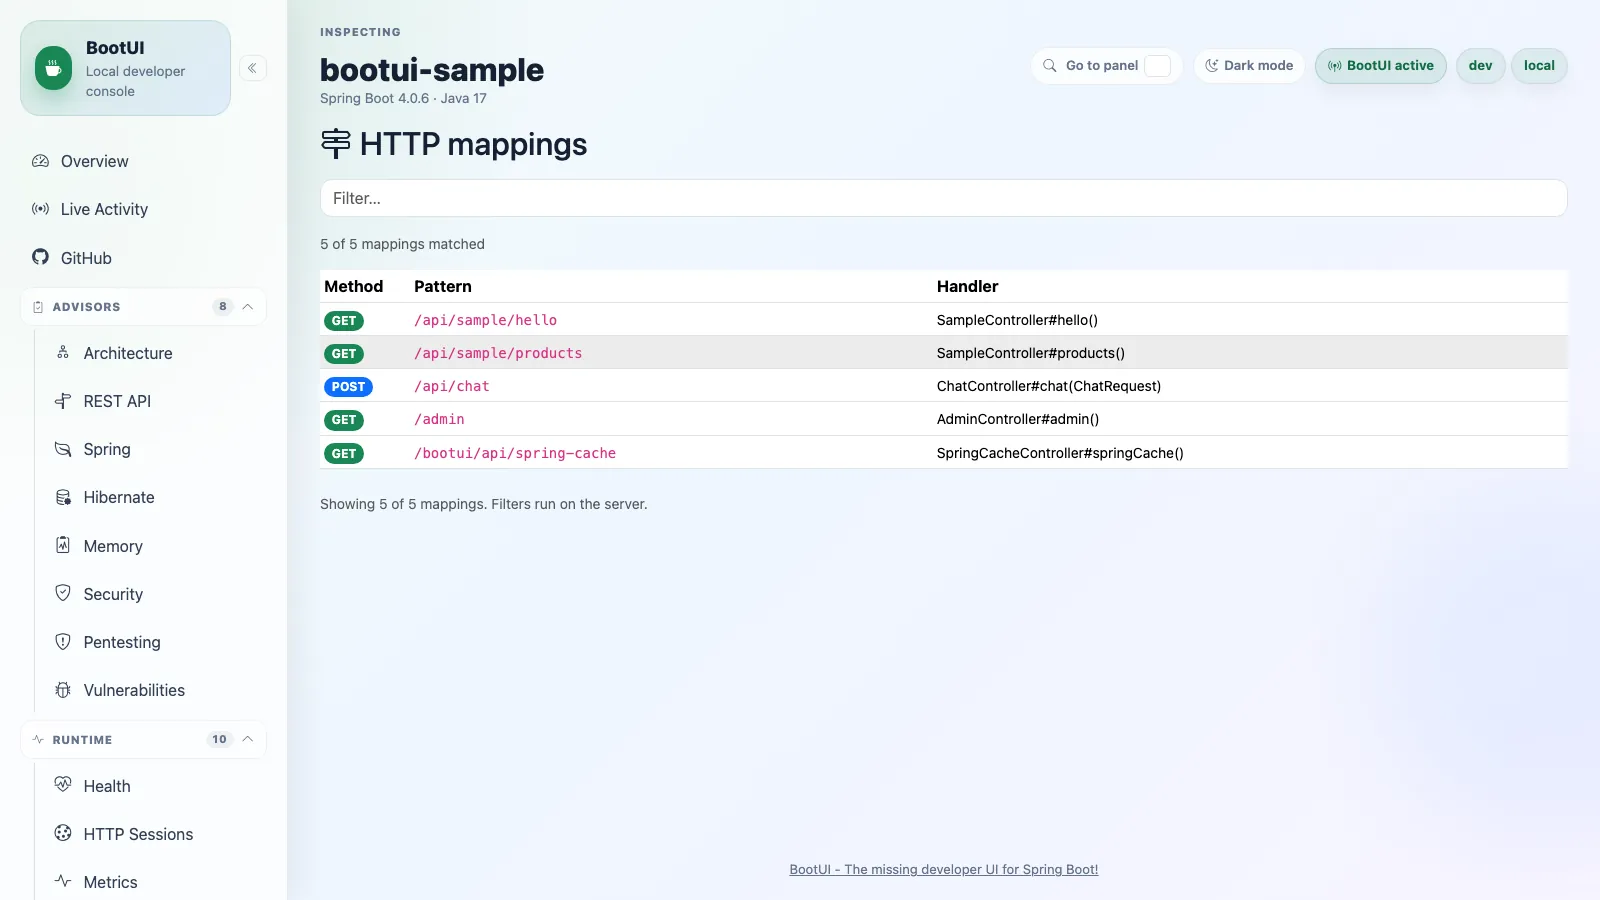
Mappings
The Mappings panel lists HTTP routes from the running application's route table (Actuator mappings data on Spring Boot, the JAX-RS resource table on Quarkus). It shows request methods, path patterns, handlers, and produces/consumes metadata so the running application's web surface is visible without reading controllers manually. Large mapping lists load through a stable, paged BootUI DTO, and the filter continues to search every discovered route on the server.
On Quarkus the same panel is served by scanning the application's JAX-RS resources from the build-time Jandex index (Vert.x exposes no clean runtime route-enumeration API carrying the per-route method and produces/consumes the panel renders), then mapping each JAX-RS resource method one-to-one onto the same paged, filterable DTO the Spring adapter serves from Actuator. quarkus-rest is a hard dependency of the BootUI extension, so the panel is available on both frameworks; BootUI's own /bootui routes are filtered out on each.
Database
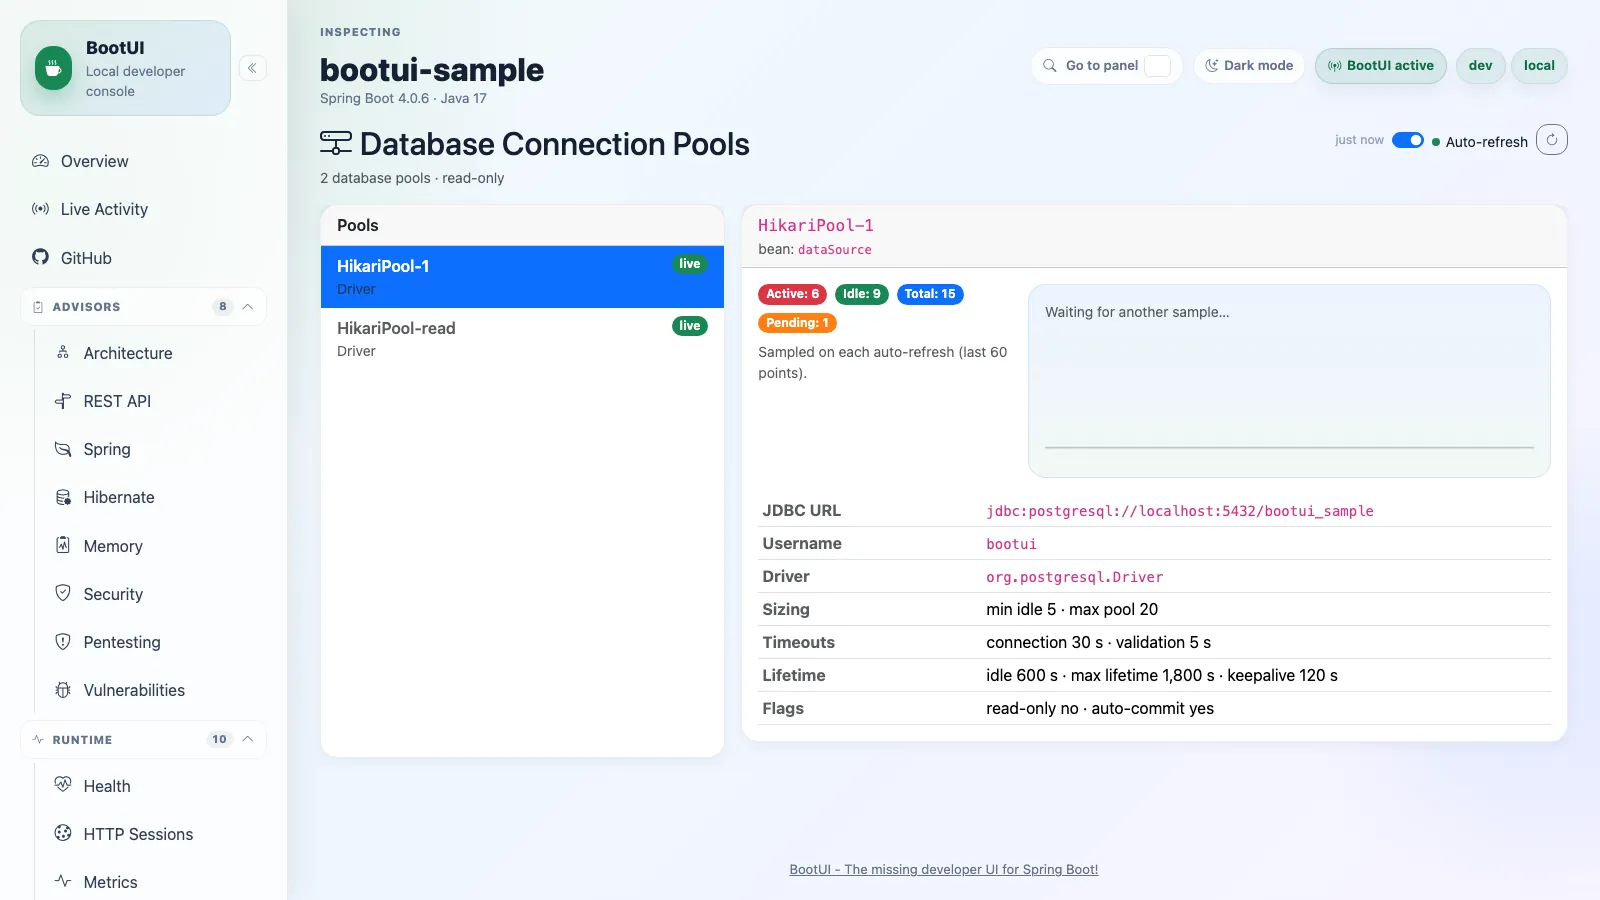
Database Connection Pools
The Database Connection Pools panel inspects supported JDBC connection pool beans. It is read-only and fails closed when no supported pool implementation or pool beans are present. For each pool it shows the pool identity, masked JDBC URL and username, driver, min/max sizing, and timeout/lifetime settings, and surfaces a clear unavailable reason for closed or uninitialized pools. A local live chart polls bounded snapshots of active, idle, total, and pending connections every two seconds so you can watch saturation trends without leaving BootUI. It never executes SQL, borrows connections, or resizes pools.
On the Quarkus adapter the same panel is served over Agroal (Quarkus' pool library) instead of HikariCP: the shared engine ConnectionPoolService and the HikariPool* wire contract are unchanged, and a Quarkus provider maps the live Agroal pool configuration and AgroalDataSourceMetrics (active/available/awaiting counts) into the same DTO shape — so the panel looks and behaves identically. Pool metrics require quarkus.datasource.jdbc.metrics.enabled=true; with metrics disabled the pool configuration still renders but the live snapshot is marked unavailable. A few Hikari-specific fields have no faithful Agroal equivalent and are reported as neutral defaults (per-call validation timeout, keepalive interval, and read-only flag).
SQL Trace
The SQL Trace panel shows the SQL statements your application recently executed, captured by a hand-written JDBC tracing proxy built on the JDK's own dynamic-proxy support — BootUI does not bundle a third-party database-proxy library to power this. When BootUI is active it transparently wraps each DataSource bean and intercepts statement execution on the resulting Connection/Statement/PreparedStatement/CallableStatement objects, recording the SQL text, statement type, SQL category (SELECT/INSERT/UPDATE/DELETE/DDL/OTHER), wall-clock duration, affected-row counts, batch size, originating connection, executing thread, the call site in your own application code that triggered it (when call-site capture is enabled — see below), and any failure. Spring's delegating/routing DataSource wrappers are skipped so executions are not double-counted, and wrapping fails open: if a DataSource cannot be proxied it is left untouched so application database access is never compromised.
Executions are retained in a bounded in-memory ring buffer (most recent first) alongside aggregate stats (total/average/ max time, slow-query and failure counts, per-category counters, and evictions). The panel also groups identical statements into a "Most frequent statements" table and flags repeated SELECTs that look like an N+1 access pattern (the repeat count is configurable via bootui.sql-trace.n-plus-one-threshold); a flagged group also lists the distinct call site(s) — class, method, and line — that issued it, most-recently-seen first and bounded to a handful of entries, so you can jump straight to the repository or service method causing the repetition. Each execution row expands to reveal the full statement, bound parameters, statement type, connection id, executing thread, call site, and error. A configurable slow-query threshold highlights expensive statements, and local-only Pause/Resume and Clear actions let you stop recording without unwrapping the data source or empty the buffer.
The panel is read-mostly and privacy-conscious: parameter bindings are not captured by default, and even when capture is enabled they are suppressed under metadata-only value exposure and routed through the same masking rules as the rest of BootUI; an inline warning reminds you when captured parameters are being shown in clear text. Call-site capture is a separate concern: a call site is metadata about your own application's code (class, method, line), never a bound value, so it is not privacy-gated — bootui.sql-trace.capture-call-site defaults to true and only trades a small, defensively-bounded stack walk per statement for the ability to see where a query came from; set it to false to skip that walk entirely. It fails closed when no DataSource bean is wrapped. Tracing, the initial recording state, parameter capture, call-site capture, buffer size, the slow-query and N+1 thresholds, and SQL/parameter truncation limits are all configurable under bootui.sql-trace.*.
Because the trace buffer is genuinely event-driven, the panel refreshes over Server-Sent Events instead of fixed-interval polling: the browser subscribes to /bootui/api/sql-trace/stream and the server pushes a small coalesced notification the moment a statement is captured, the buffer is cleared, or recording is paused/resumed, prompting the panel to re-fetch. The push carries no data — masking, truncation, and value-exposure rules still apply through the regular endpoint — and bursts of statements are folded into a single refresh so high-volume workloads do not flood the UI. When the auto-refresh toggle is off or the tab is hidden the stream is closed, and the panel falls back to its initial load when Server-Sent Events are unavailable.
GraalVM native images are supported. The tracing proxies are created over a fixed set of standard JDBC API interfaces, and those JDK proxies are registered as native-image proxy metadata by BootUI, so SQL Trace works in a native executable. If a proxy ever cannot be created (for example an interface set that was not registered), wrapping still fails open and the
DataSourceis left untraced rather than breaking application startup.
On Quarkus the panel is identical, running over the same framework-neutral engine recorder (the bounded buffer, grouping, stats, N+1 detection, and call-site capture are byte-identical to Spring — call site capture runs once, at the single SqlTraceRecorder.record(...) choke point both feeders below call into, so neither feeder needs its own stack-walking logic). Capture comes from two complementary feeders into that one recorder: an @Alternative Agroal DataSource that wraps the default pool with the same JDK-proxy tracer (manual JDBC access, gated on a datasource being present), and — because Hibernate ORM resolves its pool from Agroal's own registry and so bypasses that CDI DataSource — a @PersistenceUnitExtension Hibernate StatementInspector that records ORM-issued SQL for the default persistence unit (gated on quarkus-hibernate-orm; SQL from a named persistence unit is not traced). Between them the panel reaches parity with Spring regardless of whether SQL originates from raw JDBC or the ORM. Statement text, type, category, execution count and N+1 detection are full-fidelity; for ORM SQL the per-statement duration, affected-row count, and bound parameters are not available (the StatementInspector SPI exposes only the SQL text at prepare time, with no execution-end hook), so those degrade cleanly while never leaking ORM parameter values. Both feeders are wired in dev/test only and never in production.
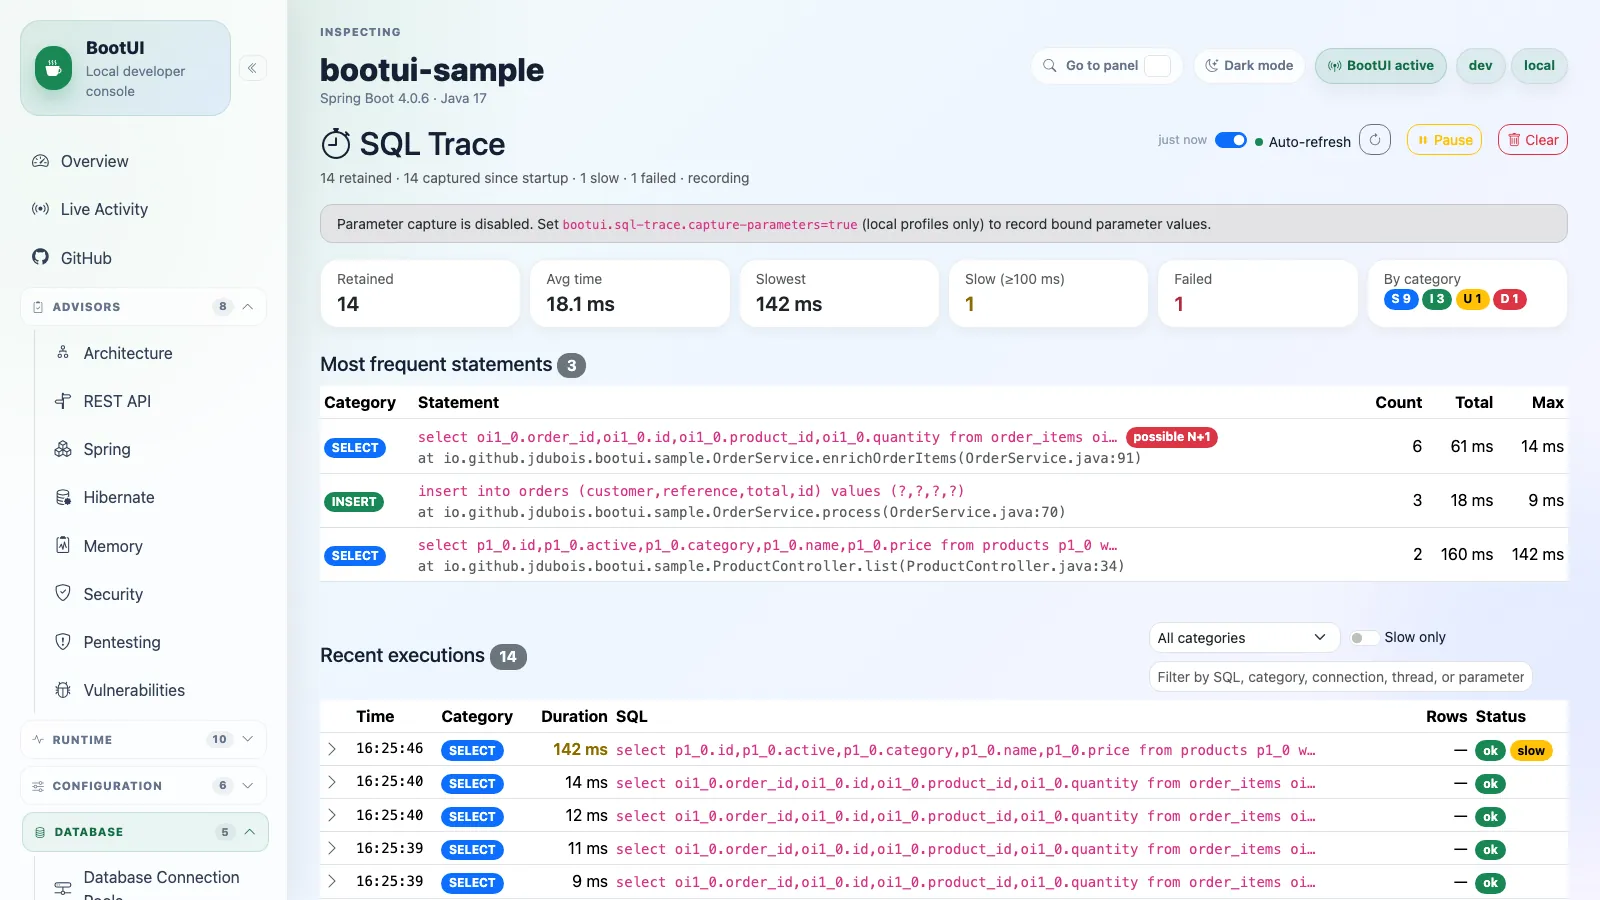
Spring Data
The Spring Data panel inspects Spring Data repositories. It shows repository interfaces, domain types, ID types, and query methods, and degrades to a clear empty state when Spring Data is not present or no repositories are registered.
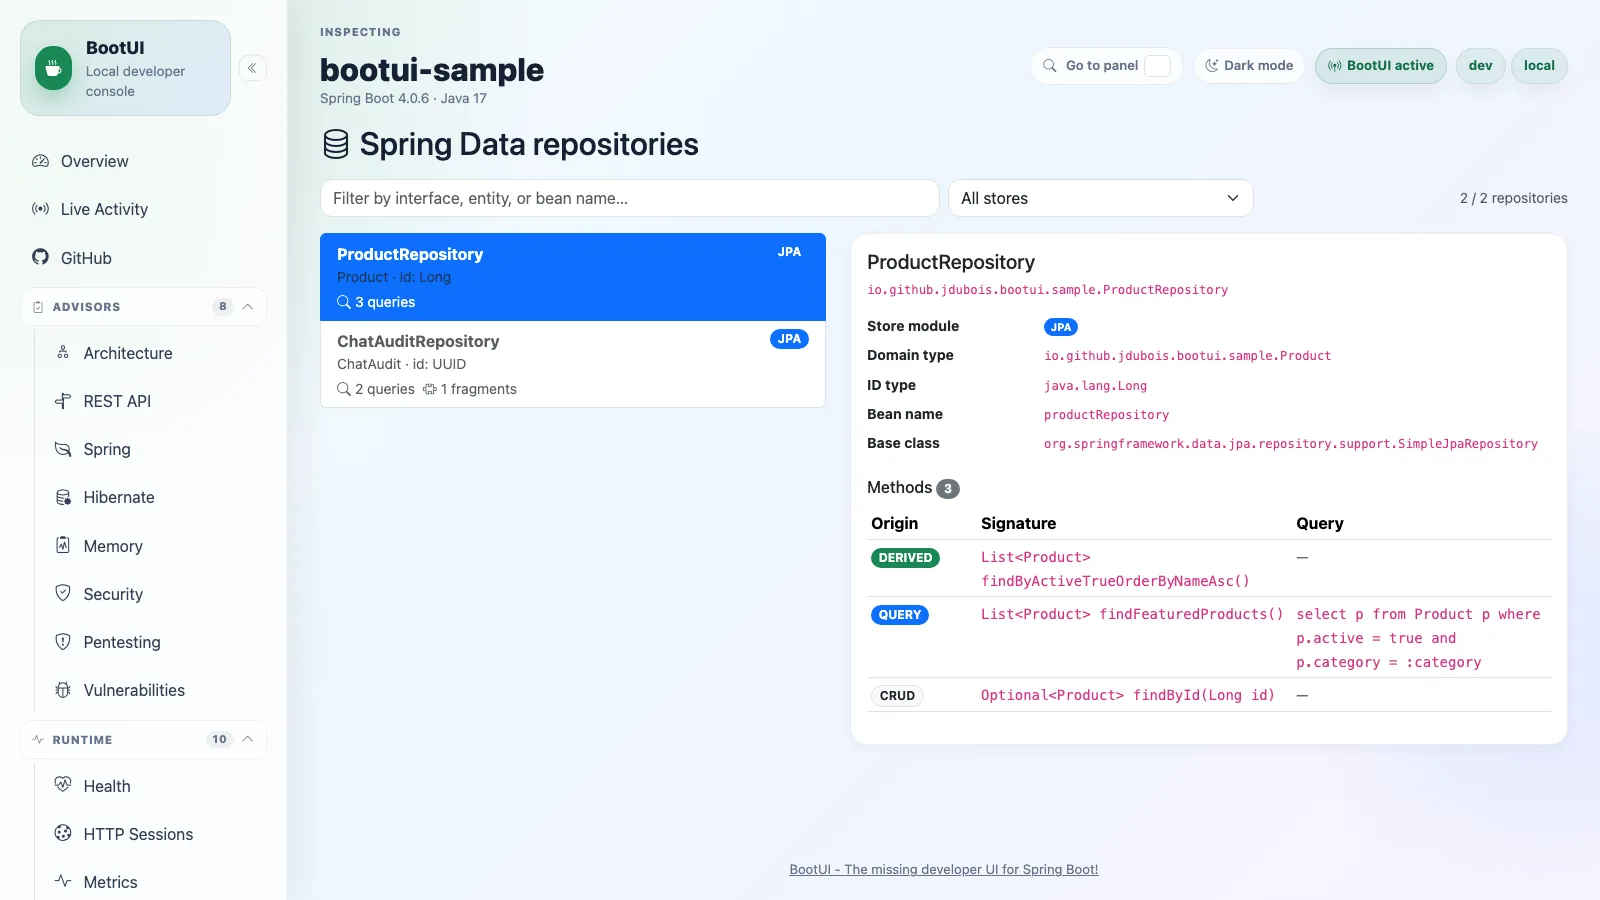
Flyway
The Flyway panel shows schema migrations for each Flyway bean in the context and lists, per database, the current schema version together with applied and pending migrations (version, description, type, script, state, installed-by, installed-on, execution time, and checksum). Multiple or named datasources appear independently. When Spring Modulith module-aware Flyway migrations are active, the panel shows the root and module-specific history tables separately so module-local migrations are visible even though Spring Modulith creates those Flyway views only during migration.
The panel also exposes confirmation-gated migrate and clean actions. They are available by default for trusted local sessions and are blocked by bootui.read-only=true or bootui.panels.flyway.read-only=true; clean also requires Flyway's own clean-disabled=false setting. Spring Modulith module-aware entries are read-only in BootUI because their module-specific history tables are managed by Spring Modulith's migration strategy. The panel degrades to a clear empty state when Flyway is not on the classpath or no Flyway beans are present.
On Quarkus the panel is identical, running over the same framework-neutral engine FlywayService and the same report contract — because both frameworks use the same org.flywaydb.core.Flyway library. The Quarkus adapter reads the active io.quarkus.flyway.runtime.FlywayContainer beans (one per datasource, default or @FlywayDataSource-named) and exposes the same confirmation-gated migrate/clean actions, with clean likewise honoring Flyway's disabled-by-default setting (quarkus.flyway.clean-disabled). The optional quarkus-flyway extension is capability-gated, so when it is absent the panel reports an honest "add the quarkus-flyway extension" reason rather than failing. The Spring Modulith module-aware history block is Spring-specific and is not reported on Quarkus.
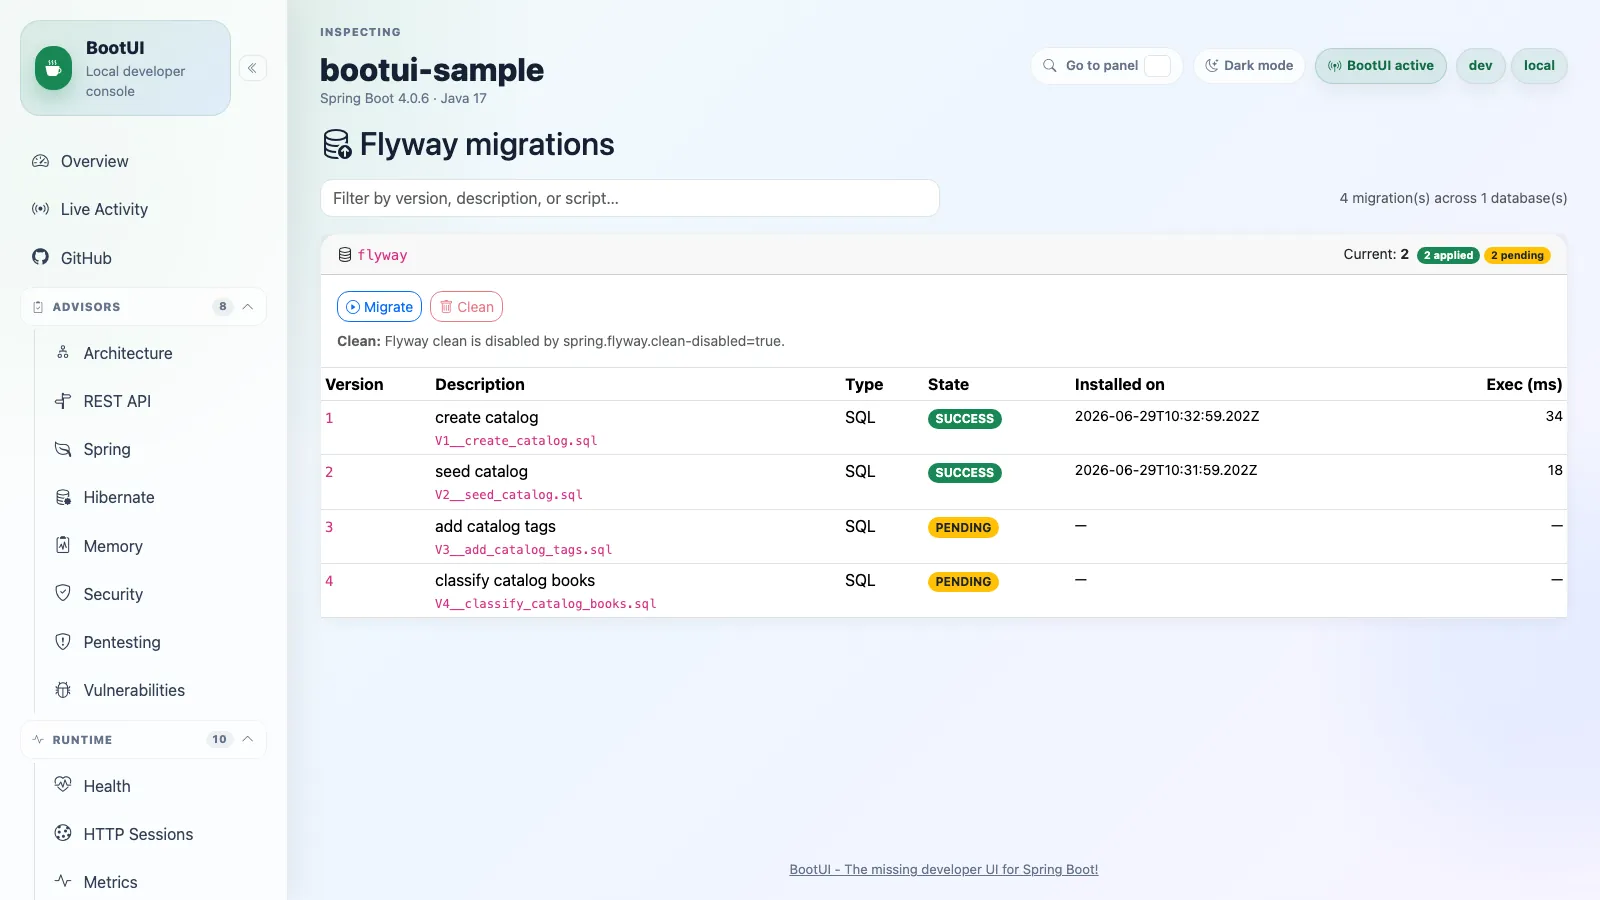
Liquibase
The Liquibase panel shows change sets for each discovered Liquibase database (on Spring Boot, each SpringLiquibase bean; on Quarkus, each active LiquibaseFactory — including @LiquibaseDataSource-named datasources). It reads the change-log history and configured changelog, then lists applied and pending change sets per database (id, author, change-log, description, comments, execution type, date executed, order executed, checksum, tag, deployment id, contexts, and labels). Multiple or named datasources appear independently.
The panel also exposes a confirmation-gated update action that applies pending change sets. It is available by default for trusted local sessions and is blocked by bootui.read-only=true or bootui.panels.liquibase.read-only=true (enforced identically on Spring and Quarkus). The panel fails closed per database when its history cannot be read and degrades to a clear empty state when Liquibase is not on the classpath or no Liquibase databases are present.
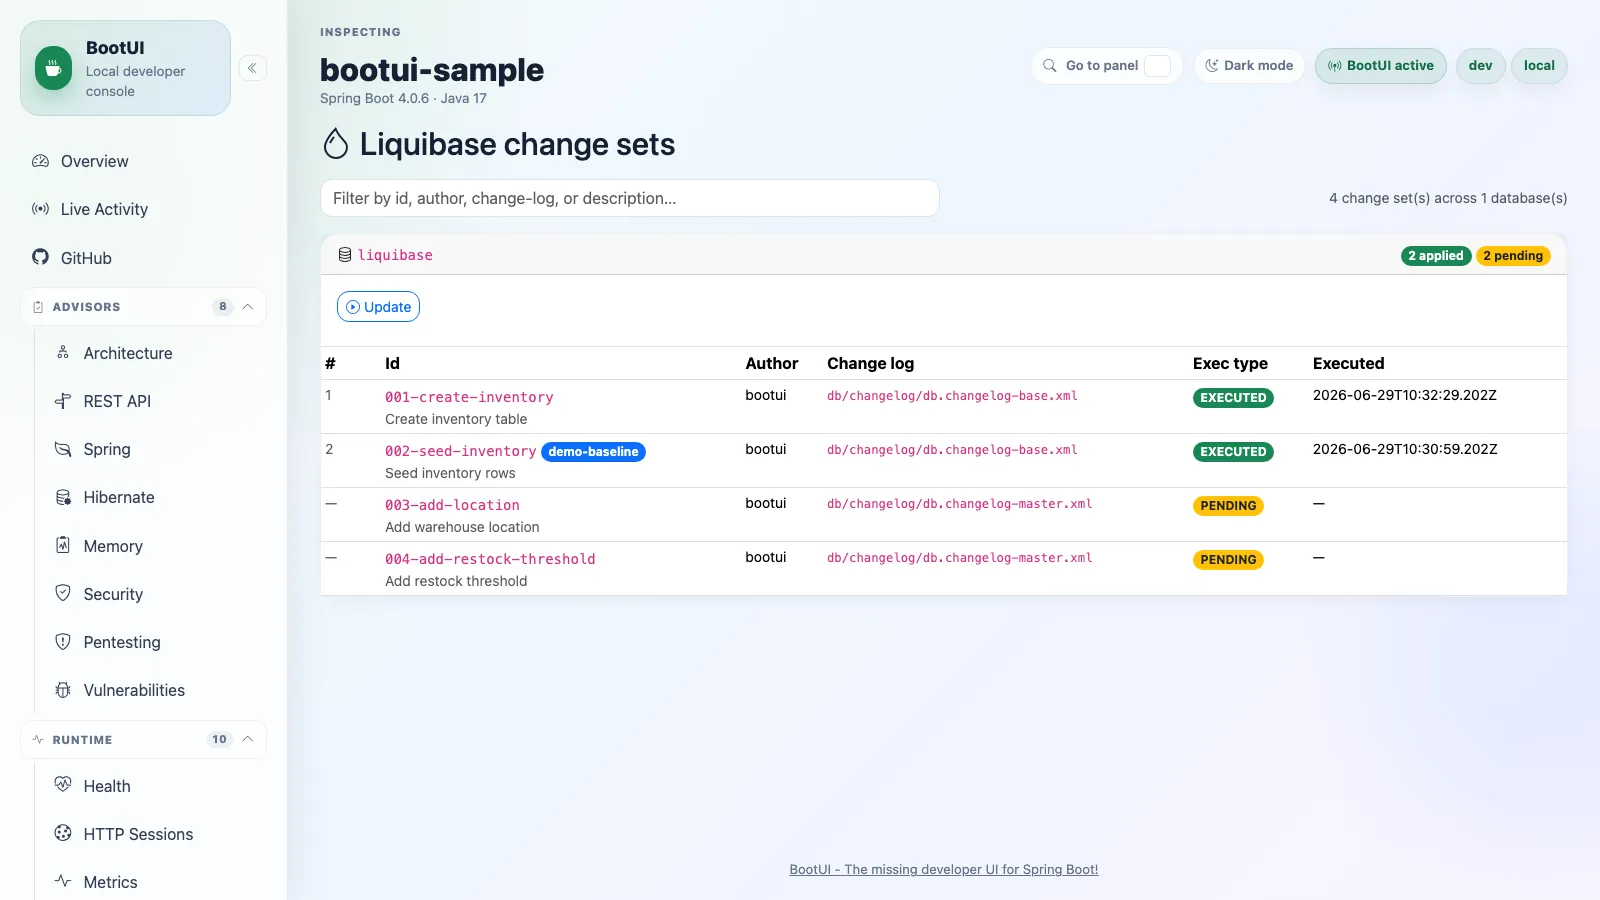
Security
Spring Security
The Spring Security panel inspects Spring Security filter chains and provides best-effort endpoint rule explanations. It is meant to explain local security wiring without exposing credentials or replacing a full security audit.
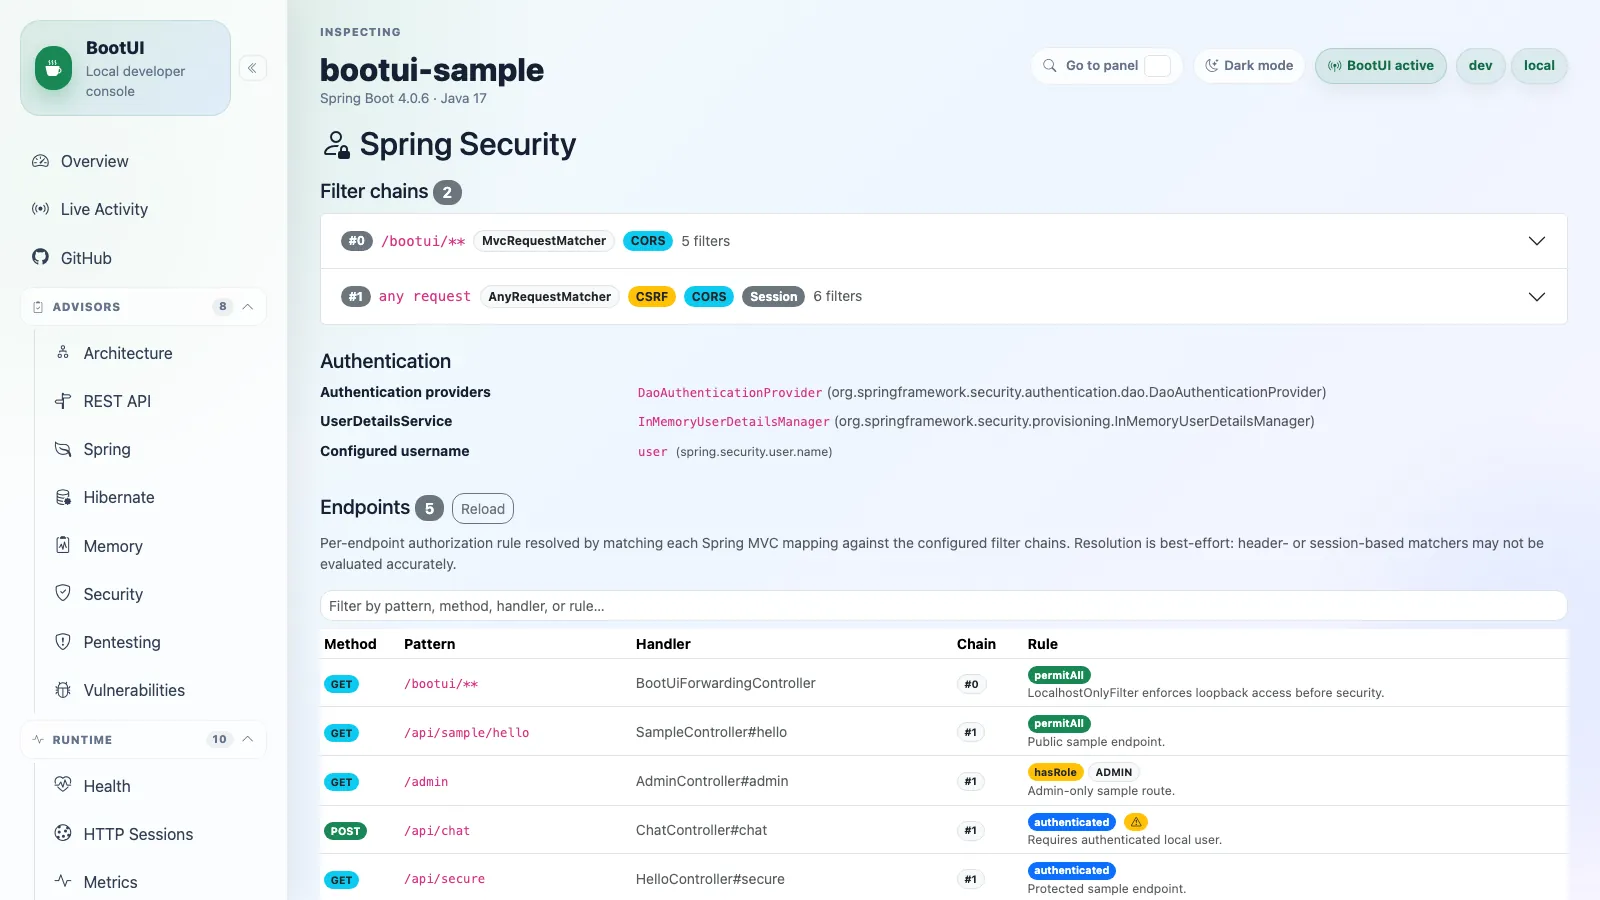
This panel is not yet ported for Spring Boot WebFlux: it reads the servlet SecurityFilterChain bean chain, which a reactive application never registers (a reactive Spring Security setup registers a WebFilterChainProxy/ SecurityWebFilterChain instead). See docs/WEBFLUX-SUPPORT.md for the current status.
Security Logs
The Security Logs panel reads recent Spring Boot audit events from the application's AuditEventRepository, including authentication successes/failures and authorization denials when Spring Security audit listeners are active. When BootUI is active and the panel is enabled, it contributes an in-memory repository if the host app has not already defined one, which also lets Spring Boot create its standard audit listeners. It supports filtering by principal, event type, and time window, summarizes retained event counts by type, refreshes live over Server-Sent Events (the browser subscribes to /bootui/api/security-logs/stream and re-fetches when the server signals a new audit event, instead of polling on a timer), and masks sensitive event data before rendering. Responses are bounded by bootui.security-logs.max-logs, which defaults to 500; if audit support is explicitly disabled with management.auditevents.enabled=false, the panel remains unavailable.
On Quarkus, the panel sources its events from CDI security events (io.quarkus.security.spi.runtime.SecurityEvent) captured into a capped buffer instead of an AuditEventRepository. This is honestly partial: it requires a security extension with quarkus.security.events.enabled=true, and only authentication success/failure and authorization failure events are emitted — there is no Quarkus equivalent for logout/session events — otherwise the panel reports unavailable with a clear reason. Filtering, type summary, masking, and the bootui.security-logs.max-logs cap are identical across both frameworks.
On Spring Boot WebFlux the panel is available and identical: it reads from the same AuditEventRepository abstraction, which is itself framework-neutral (Spring publishes audit events over the ordinary ApplicationEventPublisher, regardless of servlet or reactive), so no reactive-specific capture code was needed beyond wiring the same fallback in-memory repository.
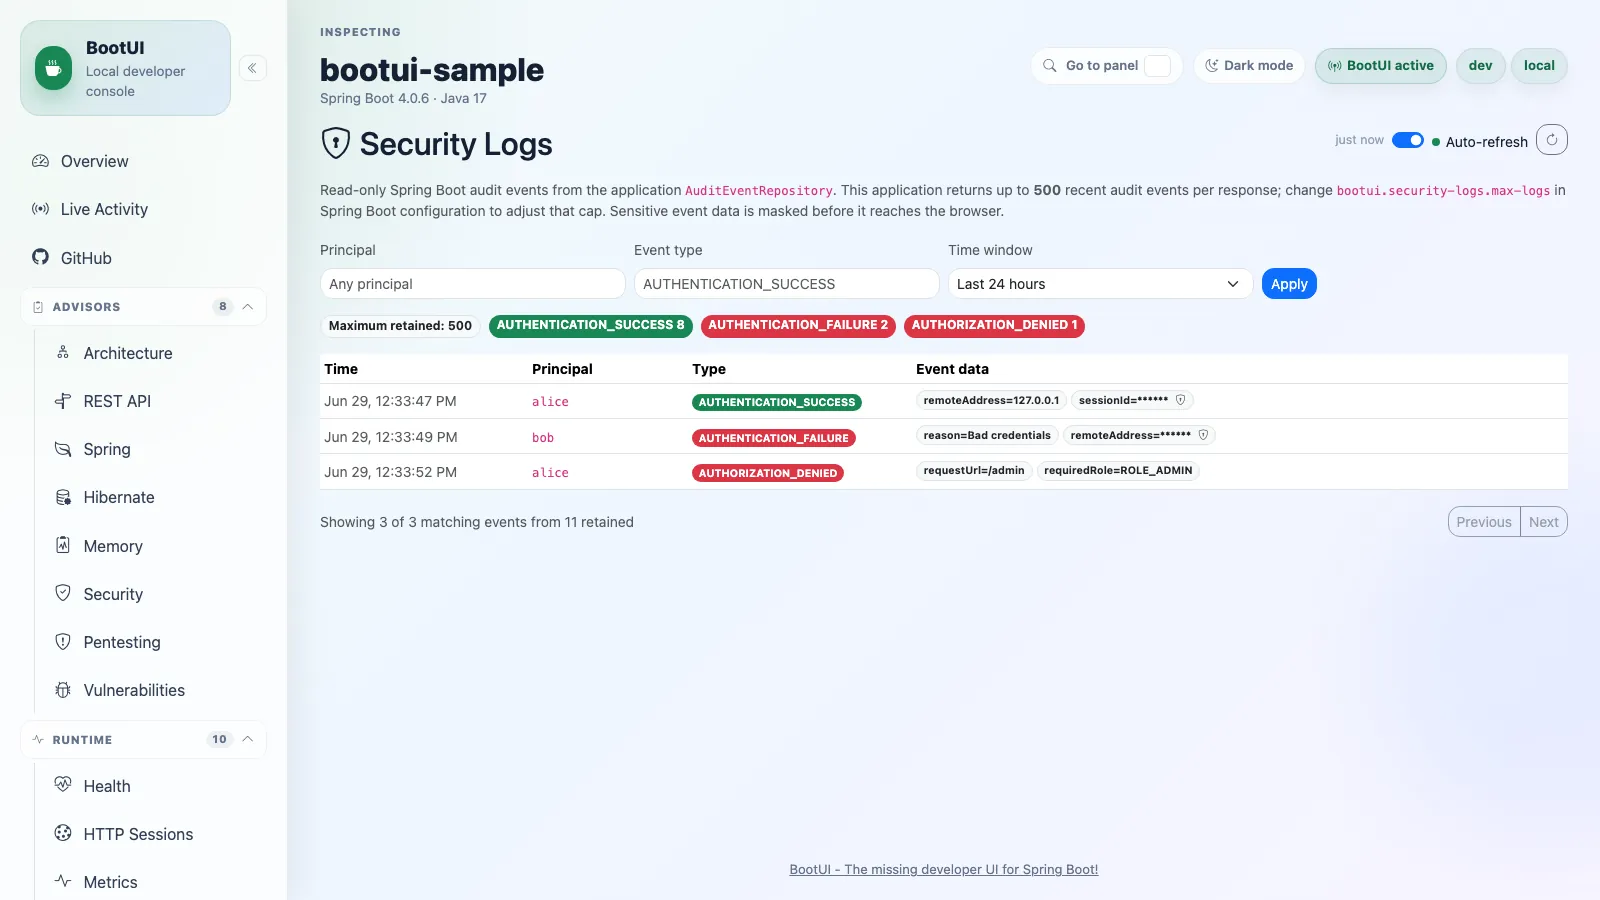
Services
Scheduled Tasks
The Scheduled Tasks panel lists scheduled jobs registered with Spring scheduling infrastructure. It shows task type and trigger metadata so background activity is visible during local development.
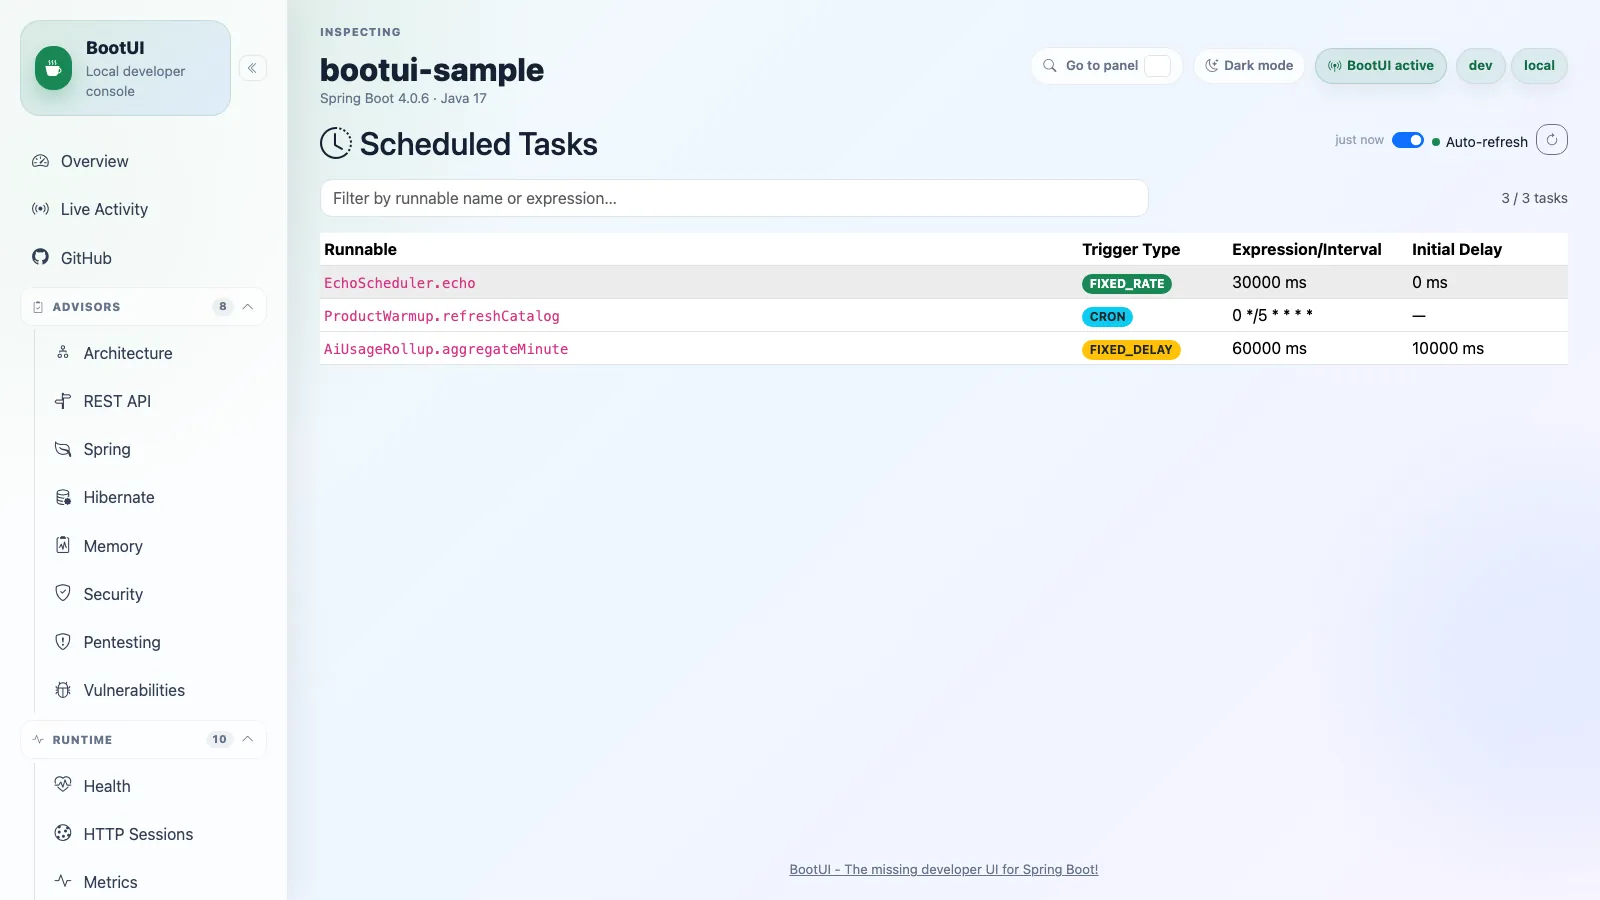
On Quarkus the panel is identical, running over the same framework-neutral engine ScheduledTasksService and the same /bootui/api/scheduled contract. The data source differs because the runtime io.quarkus.scheduler.Scheduler exposes only trigger ids and next-fire times — neither of which the shared task contract carries — while the cron/every expressions and target method are known only at build time. So the Quarkus adapter captures every @Scheduled method from the application's Jandex index at build time (the same pattern as Architecture base-package and Vulnerabilities dependency-inventory capture) and maps it onto the same trigger/expression/initial-delay fields: a cron member becomes a CRON row, an every member a FIXED_RATE row (with the duration parsed to milliseconds), and a delay/delayed initial delay is carried through. The panel is available only when the quarkus-scheduler extension is present; programmatic Scheduler.newJob() jobs are not captured (annotation-discovered tasks only).
REST Client
The REST Client panel shows outbound HTTP calls your application recently made through Spring's own REST clients, captured without a third-party HTTP proxy library. When BootUI is active it customizes every auto-configured RestClient and RestTemplate with a shared ClientHttpRequestInterceptor (one instance per client type, so the recorded client label — RestClient or RestTemplate — is always correct) and every auto-configured WebClient with an ExchangeFilterFunction, recording each call's method, host, path, query string, response status, wall-clock duration, success/failure, the client type, a trace id when one is active, the executing thread, and the call site in your own application code that issued it (when call-site capture is enabled — see below). A capture failure never disrupts the outbound call itself: both instrumentation points always let the request through and only best-effort record around it.
Calls are retained in a bounded in-memory ring buffer (most recent first) alongside aggregate stats: retained count, average and slowest duration, a configurable slow-call count, and — unlike SQL Trace's single failure counter — two distinct failure counts, because an outbound HTTP call can fail two different ways: Failed counts transport-level failures (the call never got a response — connection refused, timeout, DNS failure), while Error responses counts calls that completed with a 4xx/5xx status. A per-method breakdown badges GET/POST/PUT/DELETE/other call counts, and an "Instrumented clients" row lists which client types (RestClient, RestTemplate, WebClient) are actually wired in the running application. The panel also groups calls by method, host, and normalized path — numeric and UUID path segments collapse to {id}, so calls to /orders/1, /orders/2, … group under /orders/{id} — into a "Most frequent calls" table, flagging a group at or above bootui.rest-client-trace.chatty-call-threshold calls as a chatty (repeated-call) pattern; unlike SQL's N+1 rule, which only flags repeated SELECTs, a chatty pattern is flagged for calls of any HTTP method, since looping a POST/PUT once per item is just as real and costly an anti-pattern as looping a GET. A flagged group also lists the distinct call site(s) that issued it, most-recently-seen first and bounded to a handful of entries. Each individual call row expands to reveal the full URI, captured request headers, client type, trace id, executing thread, call site, and error message, and can be filtered by HTTP method, a slow-only toggle, or free text across URI, host, method, client, and thread. Local-only Pause/Resume and Clear actions let you stop recording without removing the client instrumentation, or empty the buffer.
The panel is read-mostly and privacy-conscious. The URI is always captured, including query parameter values — but, unlike SQL Trace's bound parameters, which are withheld wholesale unless capture is explicitly turned on, each query parameter and header value is masked by name (the same SecretMasker rules the Config and HTTP Exchanges panels use) rather than suppressed outright, so a runtime change to bootui.expose-values/bootui.mask-secrets is reflected immediately for both already-captured and new calls. Request headers are the one part not captured by default, since a header (for example Authorization) is far more likely to carry a raw secret than a query parameter; setting bootui.rest-client-trace.capture-headers=true records them, still subject to the same by-name masking. Call-site capture is a separate concern, exactly as in SQL Trace: a call site names only your own application's code (class, method, line), never a value, so it is not privacy-gated — bootui.rest-client-trace.capture-call-site defaults to true and only trades a small, defensively-bounded stack walk per call for the ability to see where it came from. The recorder bean itself is still registered unconditionally whenever the panel is enabled — it doubles as the source for Live Activity's REST entries on both Spring adapters — but panel-level availability (/bootui/api/panels) does not just track the bean's presence: it mirrors the recorder's own "has anything been instrumented yet" signal (the same one that drives this panel's own empty-state message), the same pattern Kafka/Email/Cache use against their own beans. So an application that never builds a RestClient, RestTemplate, or WebClient lands in the "Disabled / unavailable" section instead of showing a perpetually empty buffer; the panel flips to available the moment any one of the three is instrumented and stays that way for the rest of the run, even if the buffer is later cleared. Only the customizer that wires a given client type fails open, skipping itself entirely when that client's Spring Boot module (for example spring-boot-webclient) is not on the classpath, so an app without WebClient simply never gets a WebClient customizer rather than failing startup. Tracing, the initial recording state, header capture, call-site capture, buffer size, the slow-call and chatty-call thresholds, and URI/header truncation limits are all configurable under bootui.rest-client-trace.*.
Because the trace buffer is genuinely event-driven, the panel refreshes over Server-Sent Events instead of fixed-interval polling: the browser subscribes to /bootui/api/rest-client-trace/stream and the server pushes a small coalesced notification the moment a call is captured, the buffer is cleared, or recording is paused/resumed. The push carries no data — masking and truncation rules still apply through the regular endpoint — and bursts of calls are folded into a single refresh so high-volume workloads do not flood the UI.
Recent calls also surface in Live Activity, nested under the request that made them using the same trace-id-first, serving-thread-second correlation SQL statements use, and carry a deep link back to this panel. The "chatty" grouping above is not (yet) surfaced as a row-level badge in the merged stream the way SQL's N+1 suspicion is — it is visible only in this panel's own "Most frequent calls" table.
REST Client's dedicated panel is currently available on the Spring MVC (servlet) adapter only. Its own push-updating /stream endpoint is built on the servlet-specific SseEmitter, so BootUI does not yet expose that full panel (with its pause/resume controls, retained-call table, and "Most frequent calls" grouping) on Spring WebFlux or Quarkus. However, the underlying outbound-call capture is now shared by both Spring adapters: a WebFlux application's own WebClient calls are captured and merged into Live Activity with the same trace-id-only correlation model that WebFlux already uses there for SQL/exceptions/security. Quarkus still has no outbound REST client capture pipeline of any kind yet, so both the dedicated panel and Live Activity REST entries remain unavailable on that adapter for now.
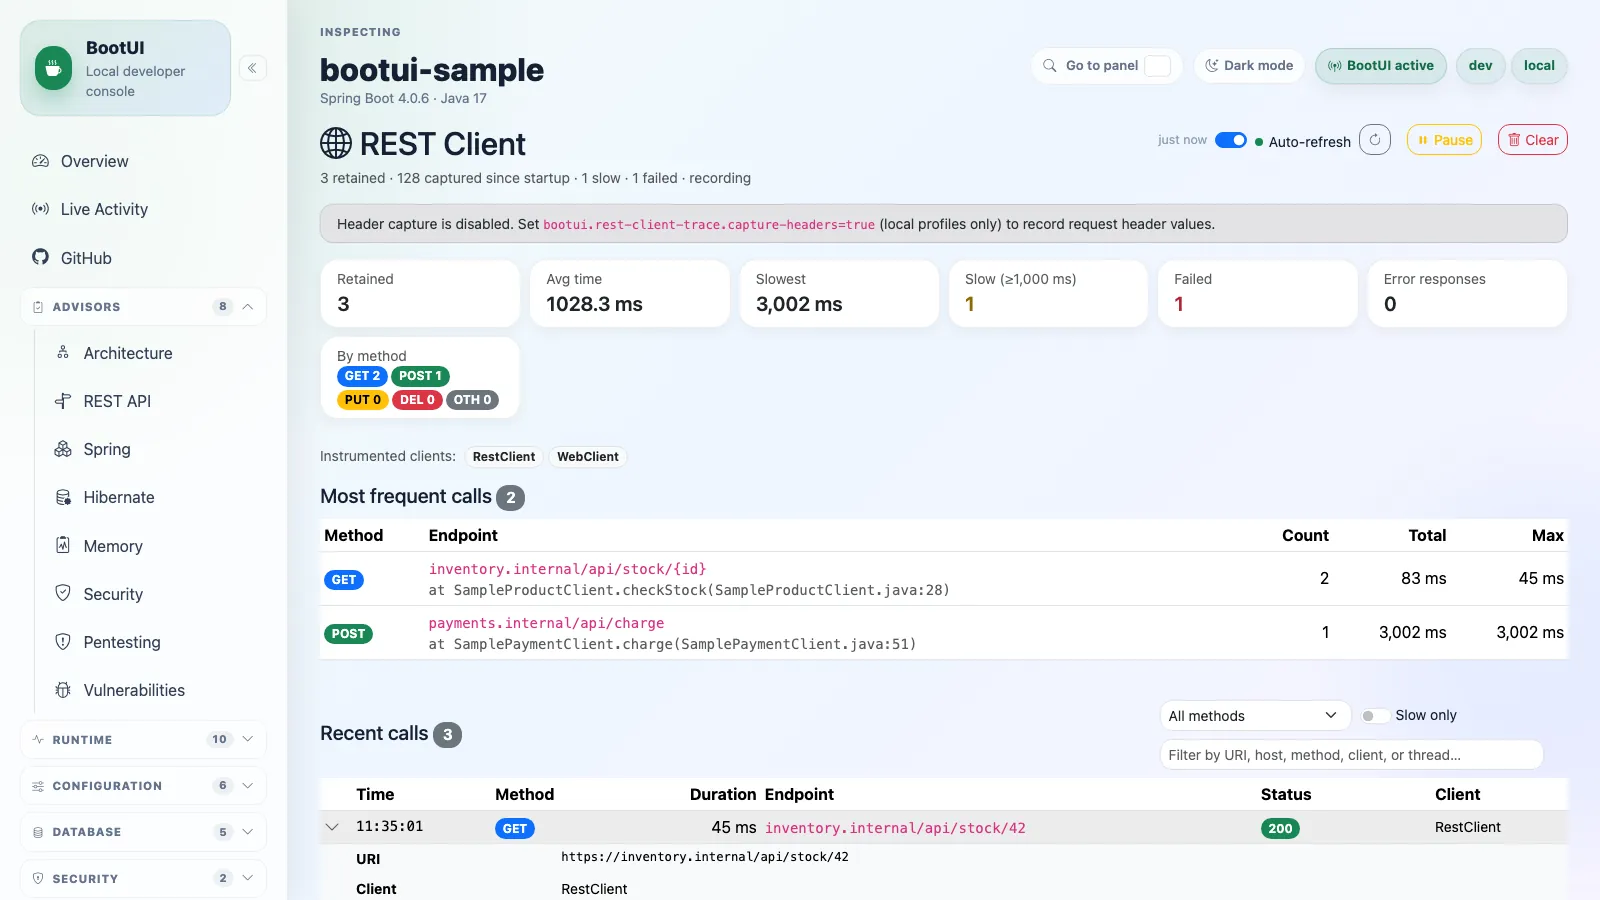
Cache
The Cache panel inspects the application's cache infrastructure on both frameworks from one shared panel and report contract: Spring's cache abstraction on Spring Boot, and quarkus-cache on Quarkus (covered below). On Spring Boot it lists cache manager beans, known caches, native implementations, safe local sizes, Micrometer cache metrics when registered, and discovered @Cacheable, @CachePut, and @CacheEvict operations. Cache clear actions are enabled by default for local development, require explicit browser confirmation, and can be disabled with bootui.cache.clear-enabled=false.
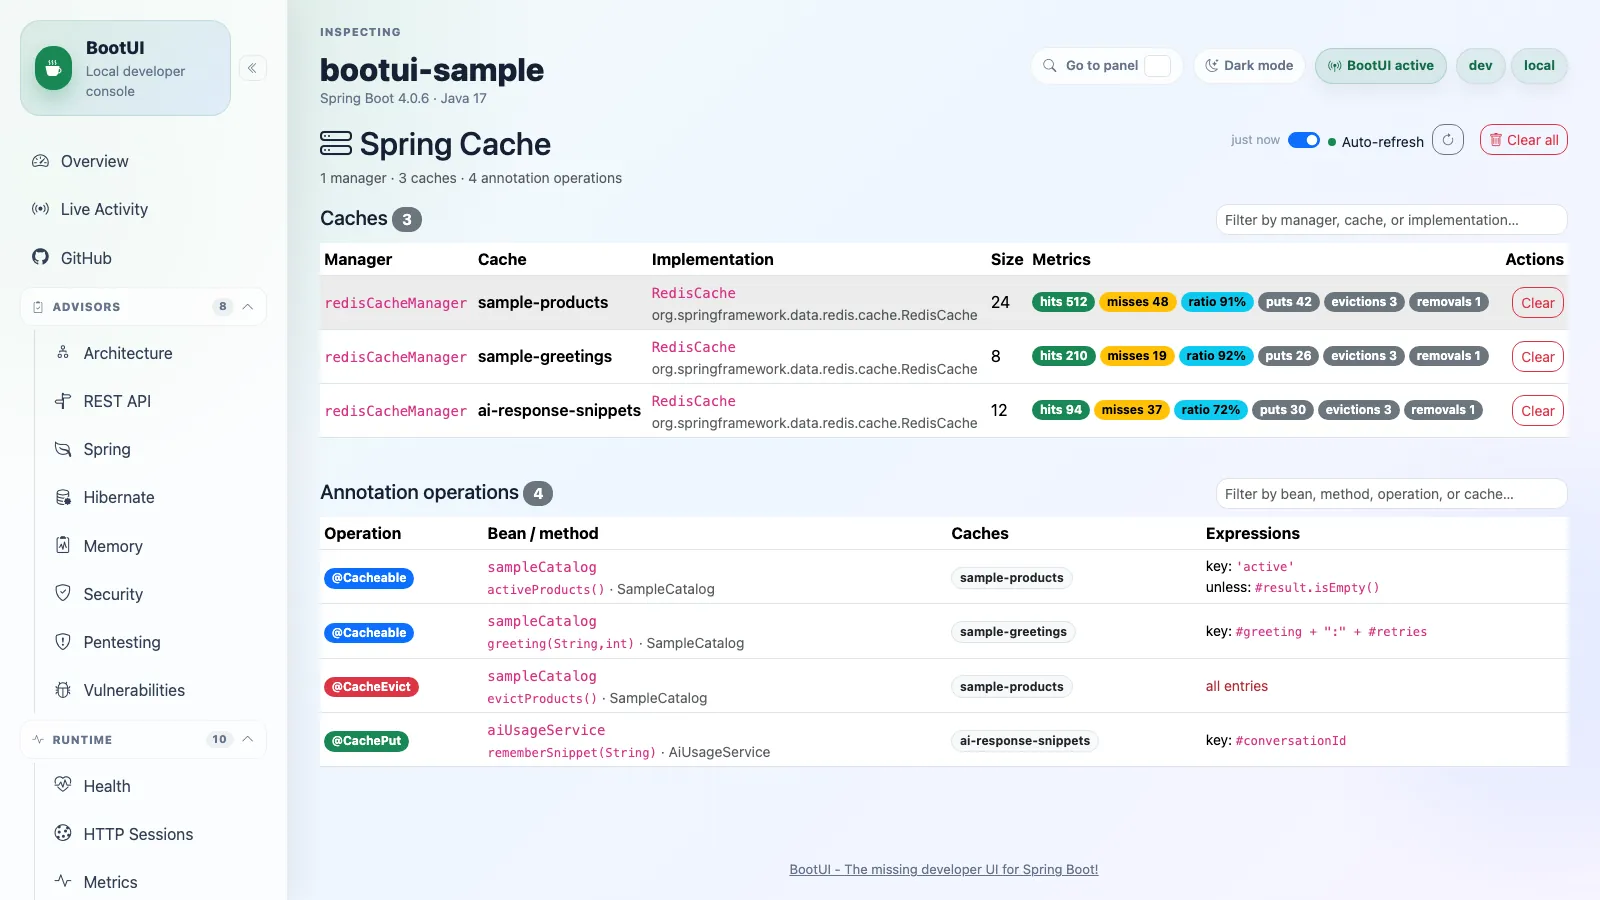
On Quarkus the same panel (kept under the shared id cache) is served over quarkus-cache: the shared engine CacheService reads the live cache topology from the application's io.quarkus.cache.CacheManager, overlays the same Micrometer cache metrics (when a quarkus-micrometer registry is present and per-cache metrics are enabled), and the clear action evicts via cache.invalidateAll(). Because Quarkus binds caching with build-time annotations (@CacheResult, @CacheInvalidate, @CacheInvalidateAll) woven into methods, there is no runtime registry of cached operations, so the operations table is replaced by a short explanatory note and the panel shows cache names + metrics + clear. The panel is gated on the quarkus-cache extension (the CACHE capability) and is reported unavailable, with a capability hint, on applications that do not use it.
The Email panel captures outgoing application mail: it intercepts the application's JavaMailSender so every outgoing send(...) call is recorded into a bounded ring buffer before delegating to the real sender — pass-through by default, so application behaviour is unchanged. Captured messages list newest-first with sender, recipients, subject, and attachment count; opening a message shows the parsed from/to/cc/bcc, an HTML preview rendered in a sandboxed iframe (scripts and same-origin access are both disabled), the plain-text alternative, and attachment metadata (name/type/size, never contents). Each message can be downloaded as a .eml file, and the whole buffer can be cleared.
Recipients, subjects, and bodies are revealed by default — consistent with BootUI's other data-capture panels (HTTP Exchanges, SQL Trace), email content is not treated as a config secret, so it is not masked by the global bootui.expose-values flag. Teams that route real customer PII through a shared dev environment can opt into masking with bootui.email.mask-content=true, which reuses the same name-based SecretMasker heuristic as Configuration/HTTP Exchanges and is only then lifted back under bootui.expose-values=FULL. An optional, explicitly opt-in dev-trap mode (bootui.email.dev-trap=true) records messages without actually sending them, similar to MailDev/GreenMail; it is off by default so BootUI never silently swallows application mail. The panel is available only when a JavaMailSender bean is present (e.g. spring-boot-starter-mail); otherwise it reports a clear unavailable reason.
On Quarkus the panel is identical, running over the same shared engine EmailCaptureService and the same /bootui/api/email contract (list/detail/.eml/clear, with the .eml bytes produced by the shared engine renderer so they match Spring's). Because Quarkus's blocking/reactive/Mutiny Mailer beans all funnel through one internal mailer that fires a CDI SentMail event after every successful send, a single @Observes SentMail observer captures every send style — the Quarkus analogue of Spring's CapturingJavaMailSender decorator. The panel is available when quarkus-mailer is on the classpath (and dark in production); otherwise it reports a clear unavailable reason. One behaviour differs by necessity: because the event fires after the send, BootUI cannot trap a message the way Spring's dev-trap does, so on Quarkus the recorded-but-not-sent distinction reflects the framework's own mock-mail mode (quarkus.mailer.mock=true, the default in dev and test) rather than a BootUI trap — the panel labels such messages mock instead of dev-trap. Attachment sizes are shown as unknown on Quarkus, since the sent-attachment API exposes none.
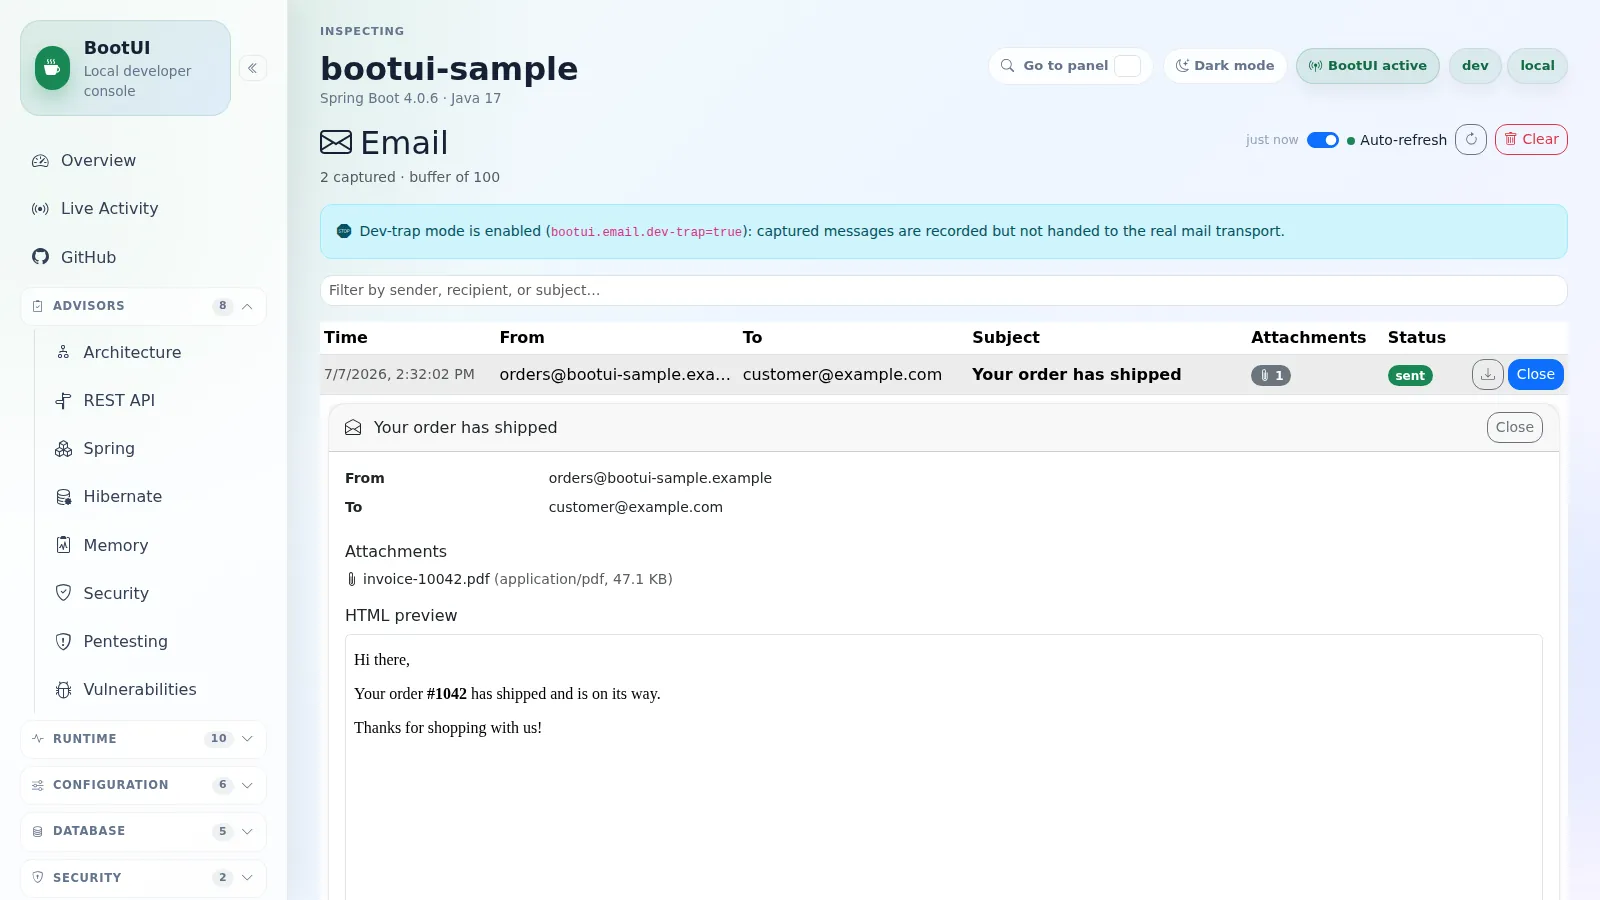
Kafka
The Kafka panel is a dedicated, filterable view over the same producer/consumer capture that already feeds MESSAGING entries into Live Activity (see above): every application-owned KafkaTemplate send and @KafkaListener consume is recorded into a bounded ring buffer, newest-first, without altering delivery. Each row shows the timestamp, direction (produced/consumed, with an icon), topic, partition, offset (consumed records only — a produced record's offset isn't known at send time), a short hash of the key, processing duration (consume only; a producer send's duration is not exposed by either framework's callback), success/failure with the underlying error available on hover, and — for consumed records — the consumer group id and listener identifier. As with Live Activity, the message value/payload is never captured, only metadata, since a Kafka payload is an arbitrary, potentially large and sensitive application object with no generic masking strategy. A text filter matches topic, key, group, and listener, a direction filter isolates produced or consumed records, and the whole buffer can be cleared.
Capture is on by default whenever a Kafka integration is present and the panel is enabled, and is tuned through the same bootui.kafka.* properties Live Activity uses (enabled, capture-key, max-entries, max-key-length) — see docs/PROPERTIES.md. Turning off key capture (bootui.kafka.capture-key=false) is reflected in the panel with a notice instead of blank hashes, and turning off capture entirely (bootui.kafka.enabled=false) leaves already-captured messages visible with a similar notice. The panel is available only when a KafkaTemplate bean is present (e.g. spring-kafka); otherwise it reports a clear unavailable reason.
On Quarkus the panel is identical, running over the same shared engine KafkaActivityRecorder and the same /bootui/api/kafka contract (list/clear); the same difference already documented for Live Activity applies here too — the listener identifier is the channel name rather than a listener container factory bean name. The panel is available when quarkus-messaging-kafka is on the classpath with at least one @Incoming/@Outgoing channel configured (and dark in production); otherwise it reports a clear unavailable reason.
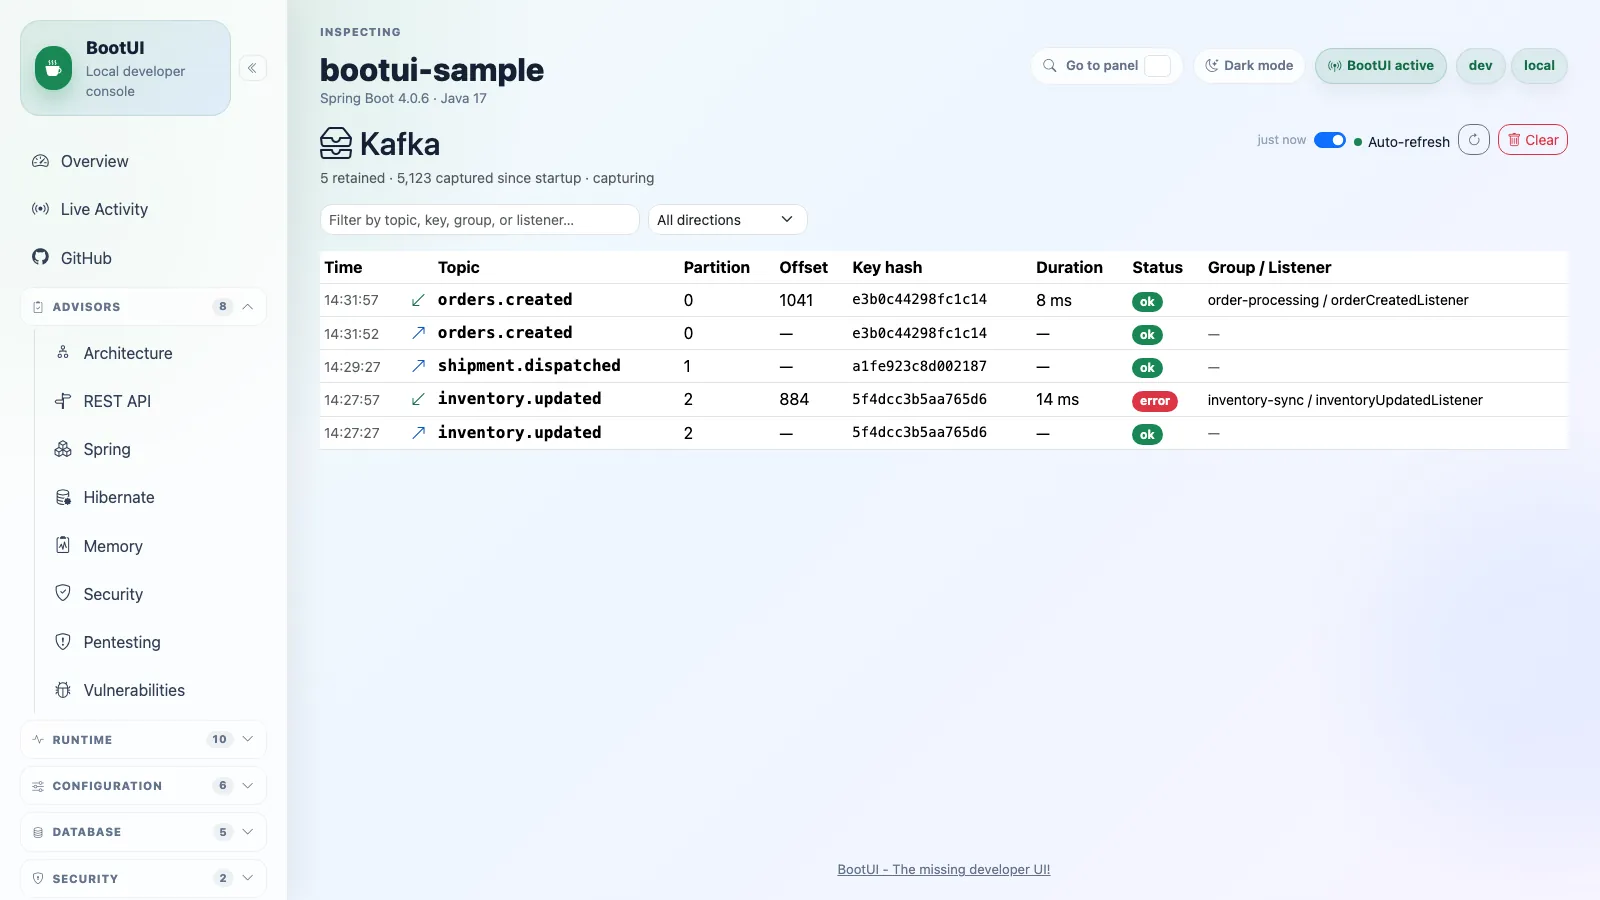
AI Usage
The AI Usage panel summarizes Spring AI and LangChain4j activity collected from OpenTelemetry spans emitted by their built-in observability. It groups chat client and chat model spans by conversation so you can see request count, token usage ( prompt, completion, total), latency, model, and the prompt/response snippet when the framework is configured to capture content (for Spring AI: spring.ai.chat.client.observations.log-prompt, spring.ai.chat.observations.log-prompt, spring.ai.chat.observations.log-completion; for LangChain4j: enable GenAI message-content capture on the OpenTelemetry instrumentation). A small inline chart shows total token usage over recent calls so you can spot expensive interactions during local development. Vector store and embedding spans appear alongside chat spans when present. The BootUI starter captures local application spans automatically when telemetry is enabled. Cooperating local services can still send OTLP spans to the embedded receiver. The sidebar dims the panel when telemetry is disabled or neither Spring AI nor LangChain4j is on the classpath, and the view explains the unavailable state. When no framework is detected, the setup checklist also shows two side-by-side guides — one for Spring AI and one for LangChain4j — explaining the dependency and configuration each needs to emit GenAI spans (including optional prompt/completion content capture). When both prerequisites are ready but no chat spans have arrived yet, the panel shows a ready empty state rather than setup guidance. Recent chats, model breakdowns, token-series windows, spans, and attributes are bounded so large local runs stay responsive. As with the Traces panel, data is sourced from BootUI's local telemetry capture, is in-memory only, and is cleared on restart.
On Quarkus the AI Usage panel is identical and reads from the same in-memory telemetry store; GenAI spans are captured when the application depends on quarkus-opentelemetry (for example alongside quarkus-langchain4j, or any OpenTelemetry GenAI instrumentation that emits the gen_ai.* semantic-convention spans). When no framework is detected, the setup checklist adapts to the platform: on Quarkus it shows a single LangChain4j guide using quarkus-langchain4j plus quarkus-opentelemetry and BootUI's in-process capture model — no embedded OTLP receiver — instead of the Spring AI / LangChain4j side-by-side guides.
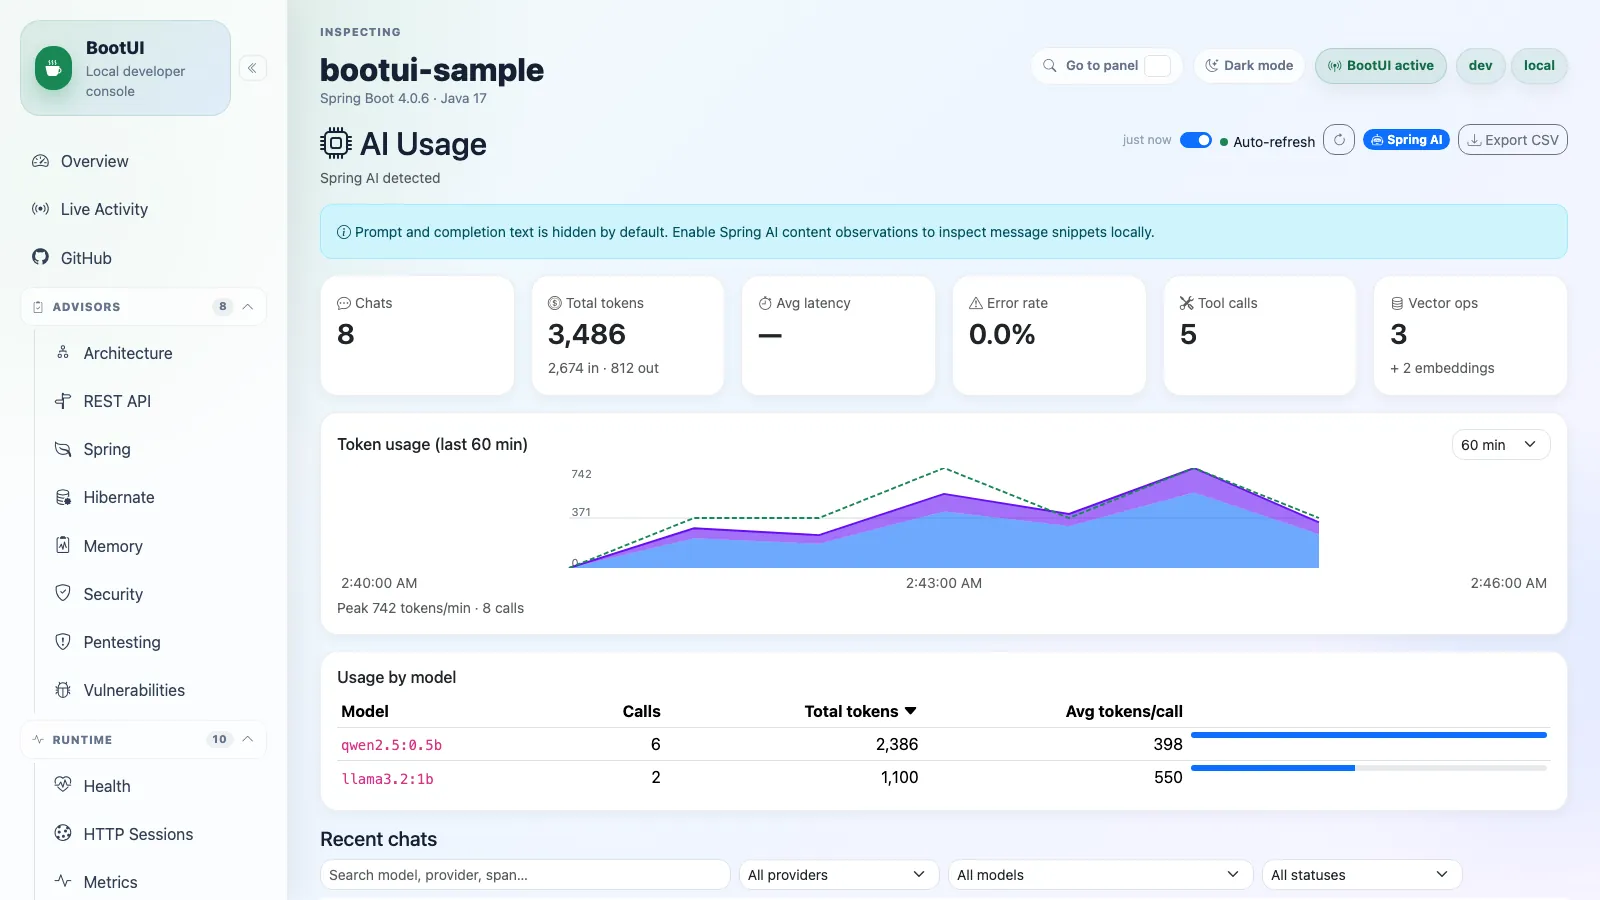
Diagnostics
Traces
The Traces panel shows distributed tracing spans captured locally by the BootUI starter when telemetry and the Traces panel are enabled. The starter contributes the tracing dependencies and sampling default needed for local development, so the host application does not need manual management.* tracing properties. Because that default raises sampling to 100% (management.tracing.sampling.probability=1.0), the OpenTelemetry SDK and Micrometer Tracing span/propagation code runs on every request; to keep that from flooding the console when the host's root logger is at DEBUG, BootUI also pins logging.level.io.opentelemetry and logging.level.io.micrometer.tracing to INFO as overridable defaults (set either key yourself to opt back in). BootUI also keeps an embedded OTLP/HTTP receiver at /bootui/api/otlp/v1/traces so cooperating local services can export spans into the same in-memory store. The list shows the most recent traces with service name, the HTTP request path each trace served (falling back to the root span name when no path attribute is present), status, duration, and span count; opening a trace renders a waterfall view of its spans so you can see latency contributions, errors, and parent/child relationships across services. Traces emitted by BootUI's own API are filtered out on ingestion by default: as soon as any span in a trace is recognized as BootUI traffic (for example the path-bearing HTTP server span for /bootui/api/**), the whole trace is dropped, including nested spans that carry no path of their own such as Spring Security security filterchain before/after observations. Retained self-only traces are also hidden from the panel, to keep the view focused on application traffic. Span ingestion can be tuned with bootui.telemetry.exclude-self-spans=false; read-time panel filtering follows bootui.monitoring.exclude-self. When bootui.telemetry.enabled=false, the sidebar dims the panel and the view shows a disabled state instead of implying that tracing is merely empty. The in-memory trace buffer is bounded by bootui.telemetry.max-traces, bootui.telemetry.max-spans-per-trace, request-size limits, and attribute-value truncation, with additional internal caps to keep misconfigured local exporters from overflowing the UI. Trace data is reset on application restart or via the panel's clear action.
The capture mechanics above (starter-contributed tracing dependencies, the management.tracing.sampling.probability default, and the logging.level.io.opentelemetry/io.micrometer.tracing pins) and the embedded OTLP/HTTP receiver are specific to the Spring Boot starter. On Quarkus the same Traces panel and in-memory store are served by the extension, but spans are captured in-process through an OpenTelemetry SpanProcessor that is registered only when the application depends on quarkus-opentelemetry — there is no embedded OTLP receiver. Self-span filtering and the bootui.telemetry.* retention bounds behave identically on both platforms. The panel's empty-state guidance adapts too: on Quarkus it points to quarkus-opentelemetry and the in-process capture model rather than the embedded /bootui/api/otlp/v1/traces receiver.
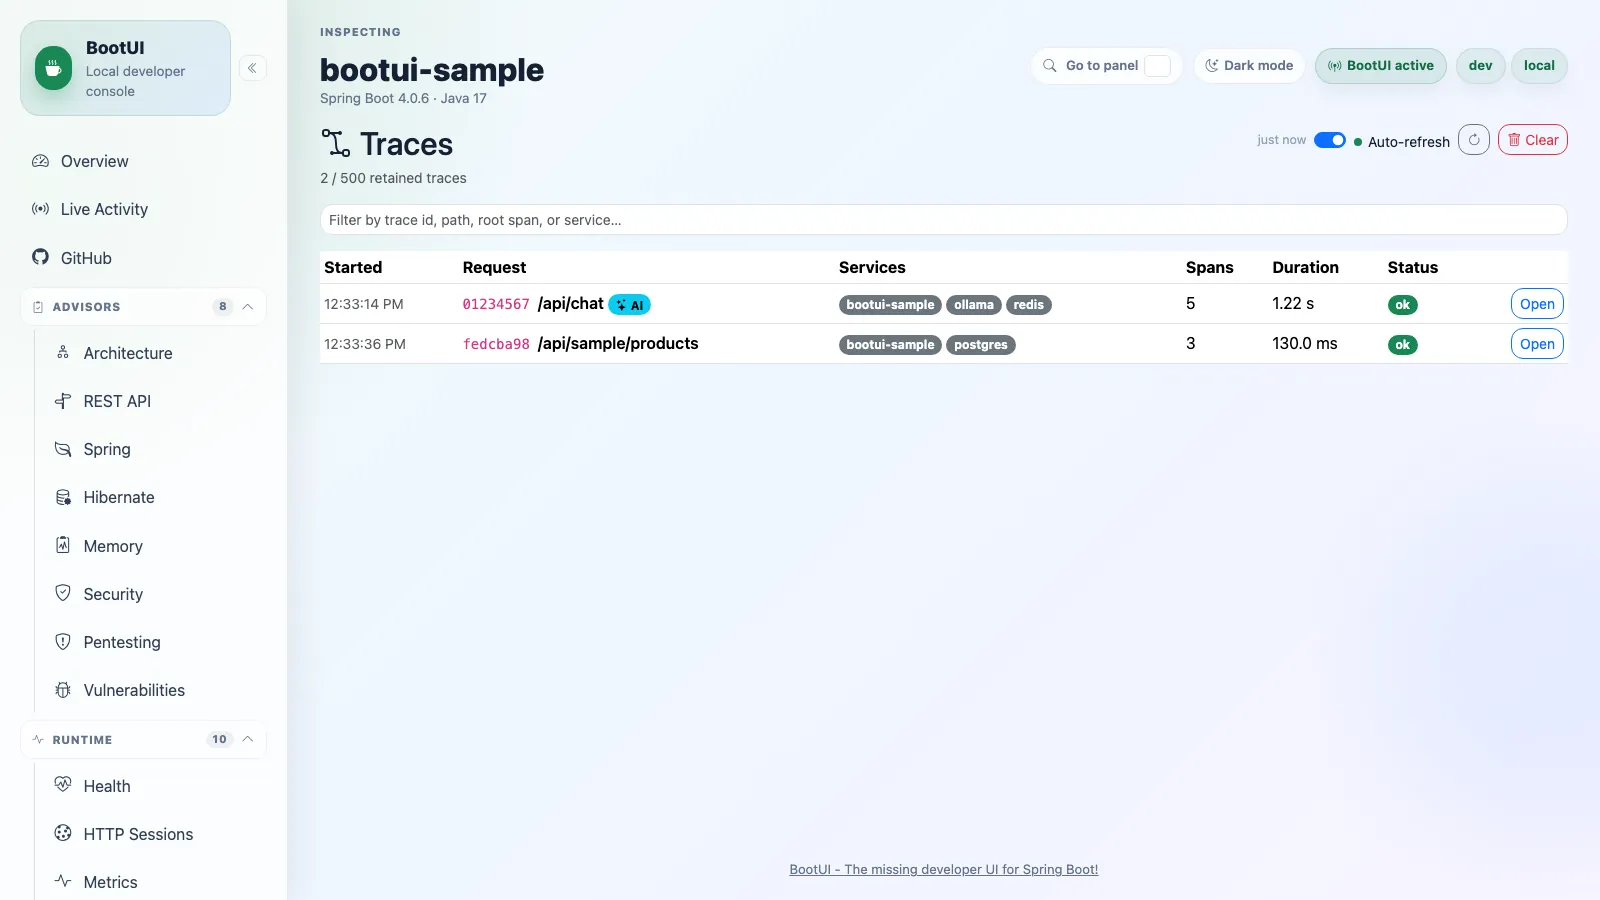
Log Tail
The Log Tail panel reads recent local application logs and streams new log events from the running process. It is intended for quick local diagnosis without leaving the BootUI console.
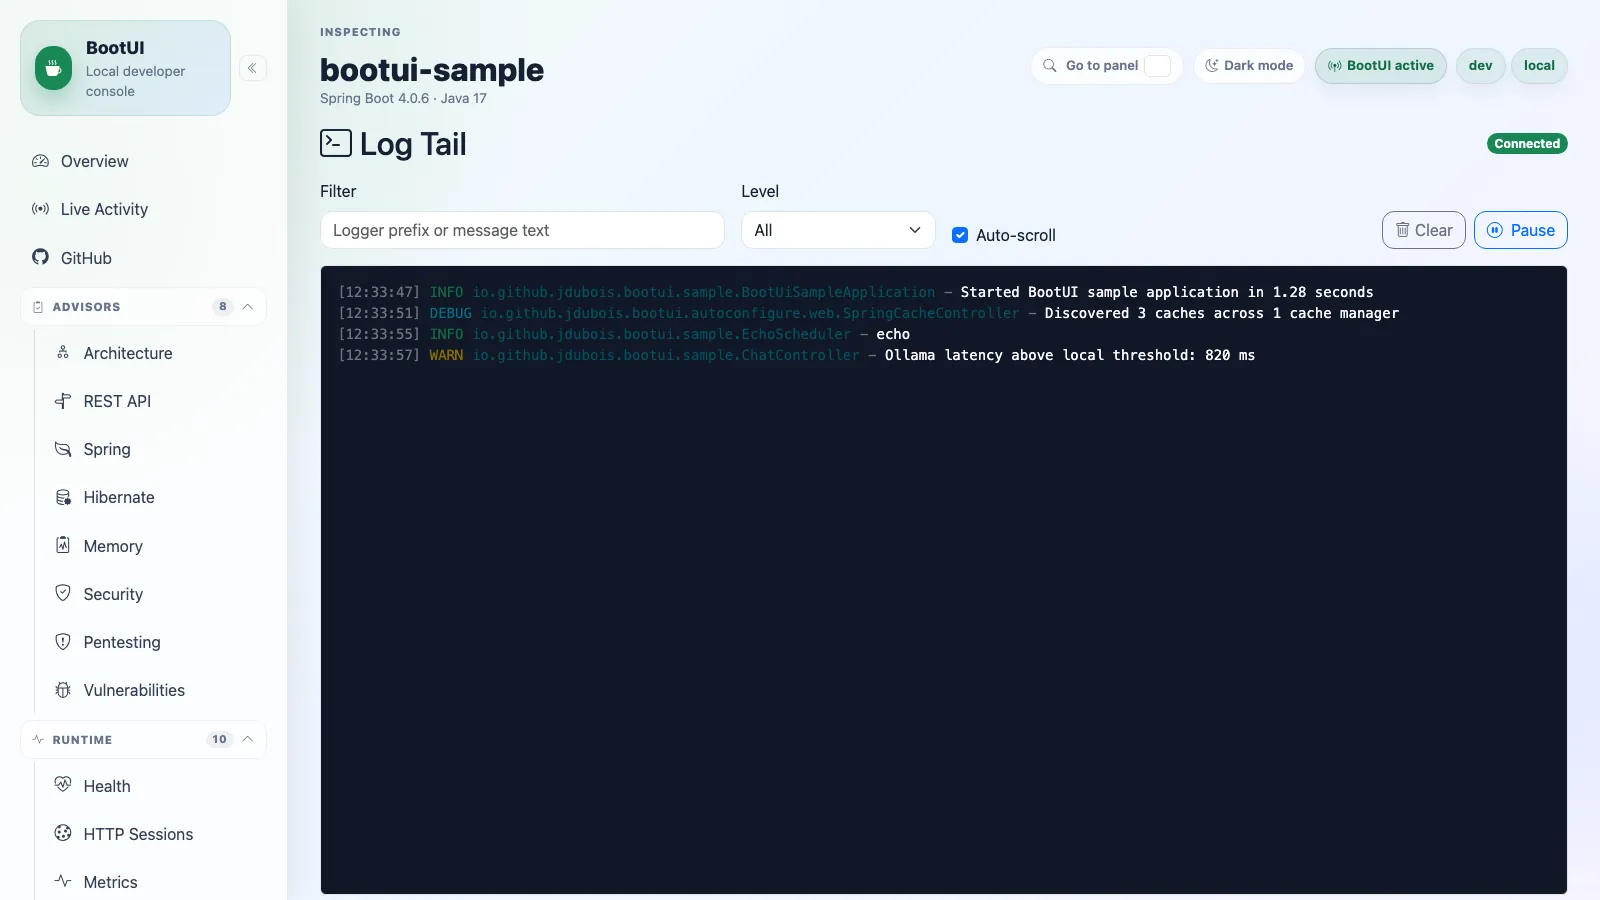
Exceptions
The Exceptions panel captures exceptions thrown by the running application and groups repeated failures into a single entry with an occurrence count. BootUI records exceptions from two complementary sources while it is active: a non-intrusive Spring MVC HandlerExceptionResolver that observes exceptions escaping web request handlers (capturing the request method, path, and handler), and a logback appender that picks up anything logged with a throwable from scheduled tasks, async work, or log.error("…", ex) calls. A failure that is both handled and logged is de-duplicated by throwable identity so it is counted only once.
Exceptions are grouped by a stable fingerprint derived from the exception type and the top stack frames, so a recurring error collapses into one row showing its type, latest message, first/last seen times, originating location, and total count. Opening a group shows the representative stack trace with application frames highlighted, the full cause chain (Caused by: … with … N more common-frame folding), and the most recent occurrences with their thread, source, and request context. The list updates live over Server-Sent Events — the browser subscribes to /bootui/api/exceptions/stream and re-fetches whenever an exception is captured or the store is cleared, rather than polling on a fixed interval — and can be filtered by text, by capture source (web vs. logged), or to application-originated exceptions only.
On top of that existing grouping, each group carries a Sentry-style triage status — Open (the default for every new group), Acknowledged (seen, still being investigated), or Resolved (believed fixed) — shown as a badge on the row and changed inline with a button group, the same one-click convention used by the Loggers panel's per-logger level setter. Changing status calls POST /bootui/api/exceptions/{id}/status with {"status": "..."}, validated against the three values (400 on anything else, 404 for an unknown group), and returns the updated group. If a group marked Resolved throws again, BootUI treats this as a regression: the group automatically reopens to Open and a lifetime "Reopened ×N" counter is incremented and surfaced next to the status badge, so a developer immediately sees that a failure they thought was fixed has come back. An Acknowledged group does not auto-transition on new occurrences — it keeps accumulating its count and last-seen time, since the developer already knows about it and hasn't claimed it's fixed; only a Resolved group can regress. An optional status filter (All/Open/Acknowledged/ Resolved) narrows the list alongside the existing text/source filters.
Exception messages follow the same exposure policy as the rest of BootUI: they are scrubbed of secret-like key=value assignments under the default bootui.expose-values=MASKED, omitted entirely under METADATA_ONLY, and shown verbatim only under FULL. Request paths are captured without their query string so query-string secrets are never surfaced, and stack frames carry only class/method/file/line information. The in-memory store is bounded by bootui.exceptions.max-groups (default 100, evicting the least-recently-seen group), bootui.exceptions.max-occurrences-per-group (default 25), and bootui.exceptions.max-stack-frames (default 50), and is reset on application restart or via the panel's clear action. The panel can be disabled with bootui.panels.exceptions.enabled=false, and clearing honors the panel's read-only setting.
On Quarkus the panel is identical, running over the same framework-neutral engine store and ExceptionsService, so the wire is byte-identical to Spring. In place of the MVC resolver and logback appender, capture comes from two complementary sources: a java.util.logging handler that records anything logged with a throwable (excluding BootUI's own loggers), and a Vert.x failure handler that records the throwable escaping a failed request with its method and path. The shared store still de-duplicates by throwable identity across the cause chain, so a failure seen by both sources is counted once. Capture is installed on StartupEvent and detached on ShutdownEvent, wired in dev/test only and never in production, and bounded by the same bootui.exceptions.* limits. The triage workflow and regression detection above are engine-level, so they behave identically on Quarkus: ExceptionsResource exposes the same POST /bootui/api/exceptions/{id}/status endpoint with the same validation and status codes.
On Spring Boot WebFlux the panel is available too, capturing into the same ExceptionStore over the same GET /bootui/api/exceptions/SSE contract and the same triage workflow. In place of the MVC HandlerExceptionResolver, capture comes from a WebExceptionHandler at the highest precedence, plus the same logback appender used on the servlet adapter. One honest, documented fidelity gap: a @RestController's own local @ExceptionHandler method consumes an exception inside the WebFlux dispatch pipeline, before any WebExceptionHandler sees it — narrower than the servlet adapter's resolver-chain-based capture, which observes @ExceptionHandler-resolved exceptions too. Unhandled exceptions (the common case) are captured identically on both stacks; see docs/WEBFLUX-SUPPORT.md for detail.
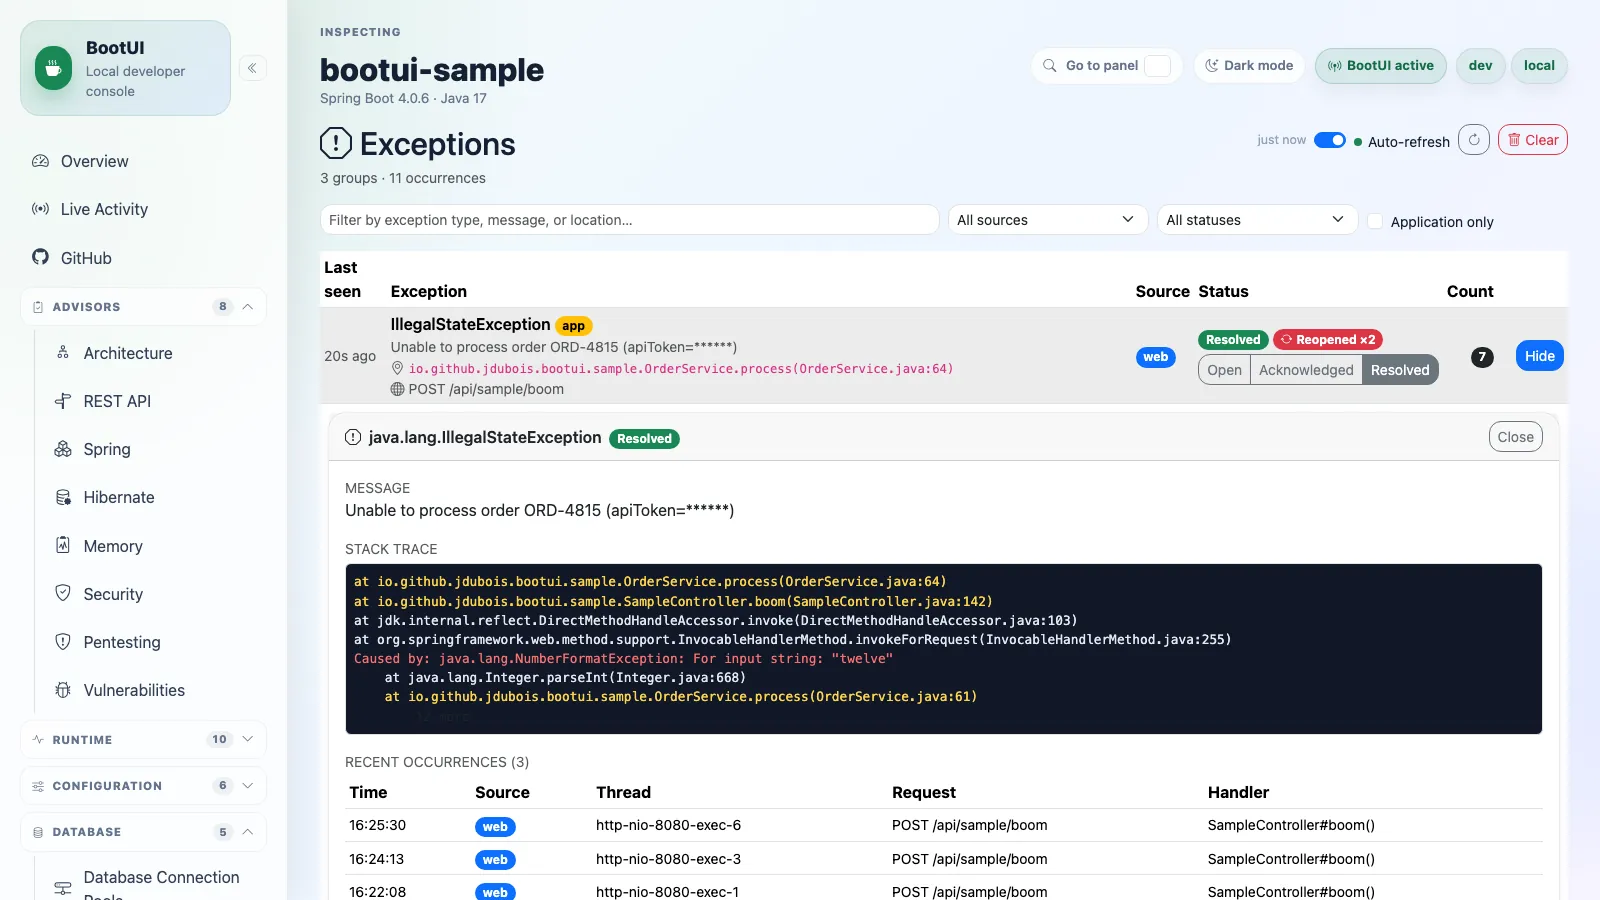
HTTP Exchanges
The HTTP Exchanges panel records recent inbound requests handled by the running application. It lists timestamp, method, path, status, duration, response size when a Content-Length header is present, and trace identifiers from common propagation headers. Expanding a row shows request and response headers, with secret-like headers and query parameters masked unless bootui.expose-values=FULL is explicitly configured. BootUI self-requests are hidden from the panel by default through bootui.monitoring.exclude-self, though they still count against the bounded in-memory recorder.
BootUI contributes an in-memory HttpExchangeRepository when the panel is enabled and no application repository already exists. The default buffer retains 200 exchanges and can be changed with bootui.http-exchanges.max-exchanges; changing that capacity requires an application restart. If the repository is unavailable, the panel shows a clear unavailable state instead of implying that no traffic has occurred.
On Quarkus the panel is identical, but Quarkus has no Actuator HttpExchangeRepository, so capture is done by a small Vert.x route filter that samples each completed request — recorded in the response body-end handler so status, duration and size are final — into a capped, framework-neutral ring buffer sized by the same bootui.http-exchanges.max-exchanges key (default 200) as Spring. The masking, trace-id extraction, self-exclusion and paging run through the same shared engine service, so the wire is byte-identical to Spring. Capture is wired in dev/test only and never in production.
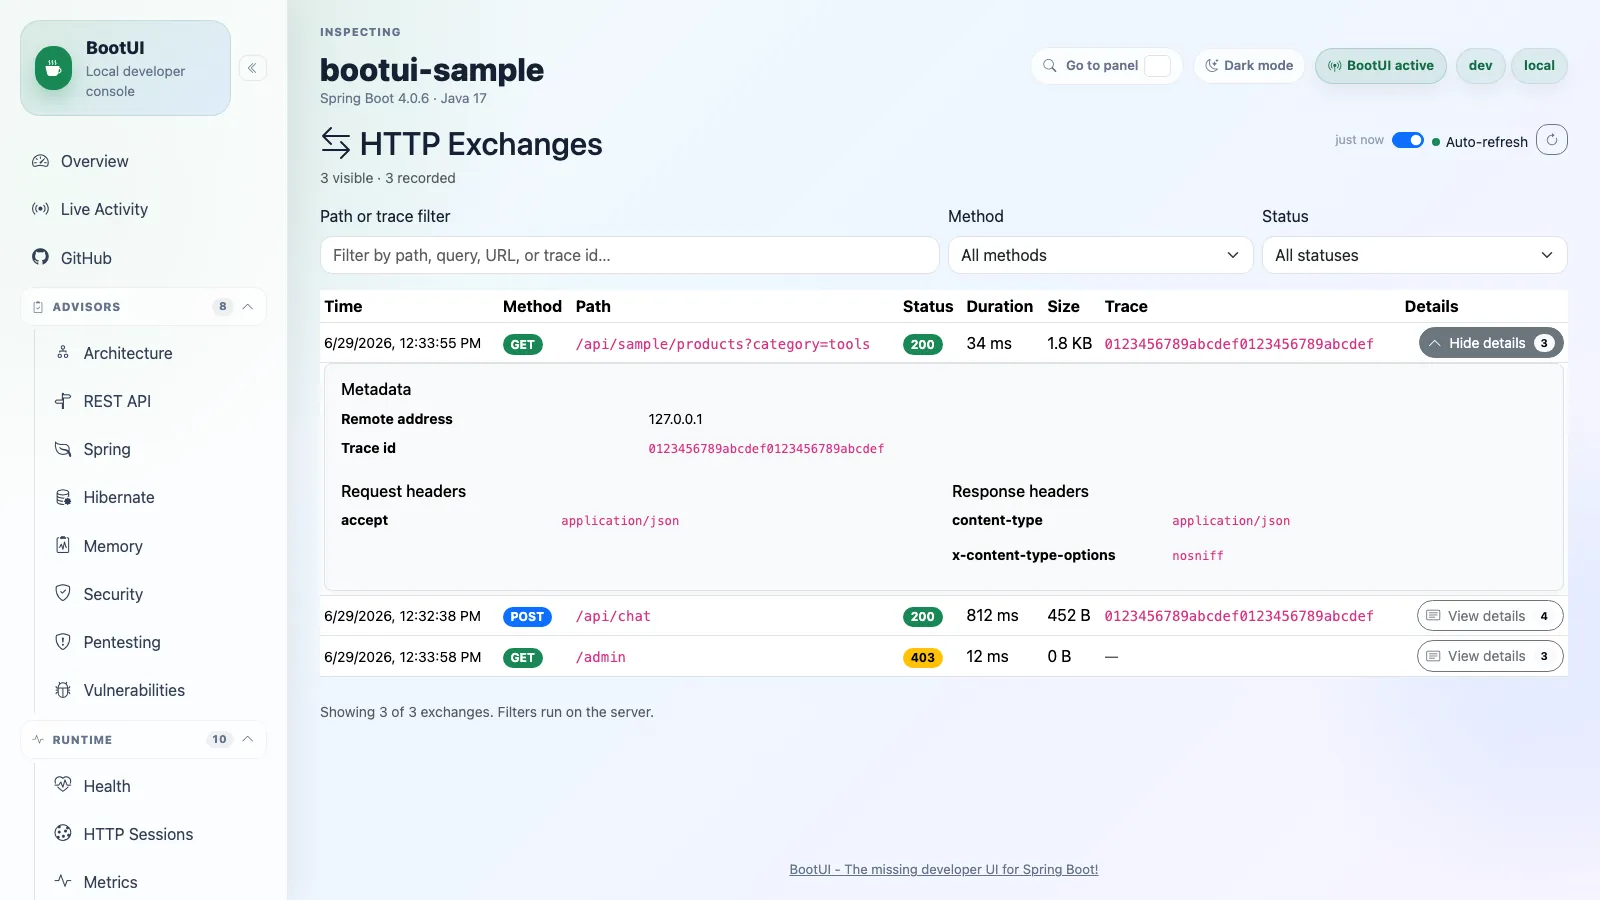
HTTP Probe
The HTTP Probe panel sends local-only requests to the running application and displays response status, headers, duration, and body. It is designed for quick route checks from inside the same local development context as BootUI.
On Quarkus the panel is identical: the probe always targets the application's own loopback address, so it can never reach an external host. The only platform difference is how the live local port is resolved — Quarkus has no single config key that always equals the bound port, so the adapter selects quarkus.http.test-port or quarkus.http.port by launch mode (and a random =0 port still resolves, because Quarkus rewrites the property to the actual port once the server is up). As a state-changing action it is gated by the same localhost-only safety floor as every other write.
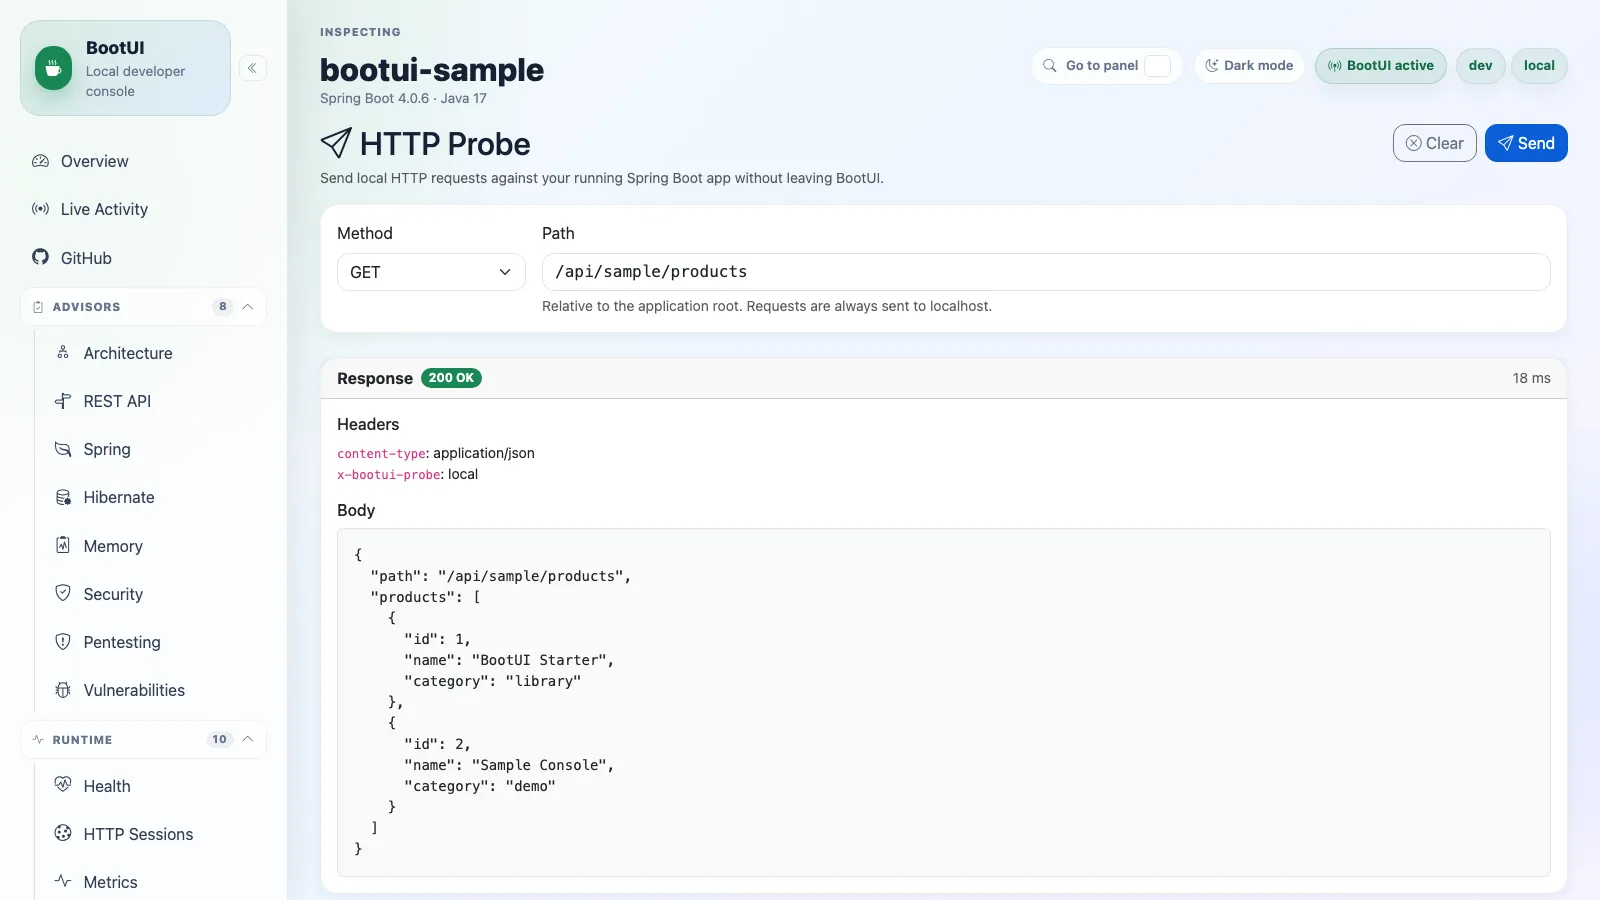
Developer tools
MCP Server
BootUI can expose its advisors and read-only diagnostics to local AI coding agents (such as GitHub Copilot or Claude Code) through a local, opt-in Model Context Protocol server, so an agent can consult the advisors before proposing a fix and pull runtime diagnostics (a correlated live activity feed, exception detail, security logs, SQL traces, HTTP exchanges) while investigating an issue. The server is a JSON-RPC 2.0 endpoint at POST /bootui/api/mcp; human-readable status and the advertised tool list are available from GET /bootui/api/mcp-server. The server is disabled by default (fail-closed) and, like the rest of the BootUI API, only reachable over the loopback interface unless non-loopback access is explicitly enabled, which requires authentication. Enable it headlessly with bootui.mcp.enabled=ON, or use the prominent toggle at the top of this panel to turn it on or off at runtime, overriding the bootui.mcp.enabled Spring Boot property for the lifetime of the running application — the configured mode only sets the initial state, and the panel shows when the live state is an override.
The panel explains what the server does and lists every tool it exposes. Tools reuse the existing controllers and DTOs rather than reimplementing anything, so every tool returns the same masked, bounded shape as the REST API, in three groups:
- Advisor scans (actions):
architecture_scan,spring_scan,hibernate_scan,memory_scan,security_scan,pentest_scan,rest_api_scan,graalvm_scan,crac_scan. Each triggers the same scan the panel's action button runs and returns the report DTO. - Diagnostics reads:
get_live_activity,get_exceptions,get_exception_detail,get_security_logs,get_sql_traces,get_traces,get_log_tail,get_http_exchanges.get_live_activityreturns the correlated feed the Live Activity panel shows (HTTP requests, SQL statements, exceptions, security events, scheduled-task runs, and — Spring only — cache accesses, grouped by request/trace);get_exception_detailtakes a requiredid(fromget_exceptionsorget_live_activity) and returns that exception group's full stack trace, causes, and individual occurrences. - Core context reads:
get_overview,get_health,get_config(masked),get_beans,get_mappings.
Tools whose backing panel/controller is not present (for example Hibernate or Spring Security when those libraries are absent) are simply not advertised. The server inherits BootUI's full safety model:
- It is only ever live while BootUI is active, so it is never reachable in production.
- The endpoint sits behind
LocalhostOnlyFilter(loopback source,Hostallow-list, cross-site write protection). It is exempt from BootUI's SPA CSRF token (which only browsers can present) so non-browser MCP clients connect with a plain HTTP config and no credentials on loopback, whileLocalhostOnlyFilter's cross-site defenses still block browser-driven writes. If non-loopback access is explicitly enabled, the client must send the configured or generated BootUI bearer token like every other remote API caller. - Read tools require the backing panel to be enabled; action (
*_scan) tools are additionally refused when the panel is read-only orbootui.read-only=true, returning a clear tool error instead of running. - Values pass through the same secret masking and
bootui.expose-valuesmode as the REST API, and paginated reads are capped bybootui.mcp.max-results.
Connection details (transport, protocol revision, and the bootui.mcp.max-results cap) are shown alongside a ready-to-use, copyable MCP client configuration JSON pointing at this running app — the servers block a GitHub Copilot or Claude Code mcp.json expects. To wire it into an agent, point the client at the loopback HTTP endpoint of your running app:
{
  "servers": {
    "bootui": {
      "type": "http",
      "url": "http://127.0.0.1:8080/bootui/api/mcp"
    }
  }
}
See docs/PROPERTIES.md for the bootui.mcp.* settings, and AI agents for an end-to-end agent workflow and how BootUI pairs with Coffilot.
On Quarkus the panel is identical, running the same live JSON-RPC bridge over the same POST /bootui/api/mcp endpoint and the same working enable/disable toggle (the bootui.mcp.* keys are read from MicroProfile Config). The protocol core — method routing, per-panel gating, tool lookup, and the max-results cap — lives in the shared framework-neutral engine; each adapter only supplies a thin Jackson envelope codec (Jackson 2 on Quarkus) and its own tool catalog, so requests and responses are byte-identical across the two backends. The advertised tools track which panels are actually live on Quarkus: graalvm_scan and crac_scan (both deliberately not applicable on Quarkus) are not offered, get_overview is advertised (the Overview panel is available, its dashboard rendering client-side), and spring_scan runs the Quarkus-native idiom advisor.
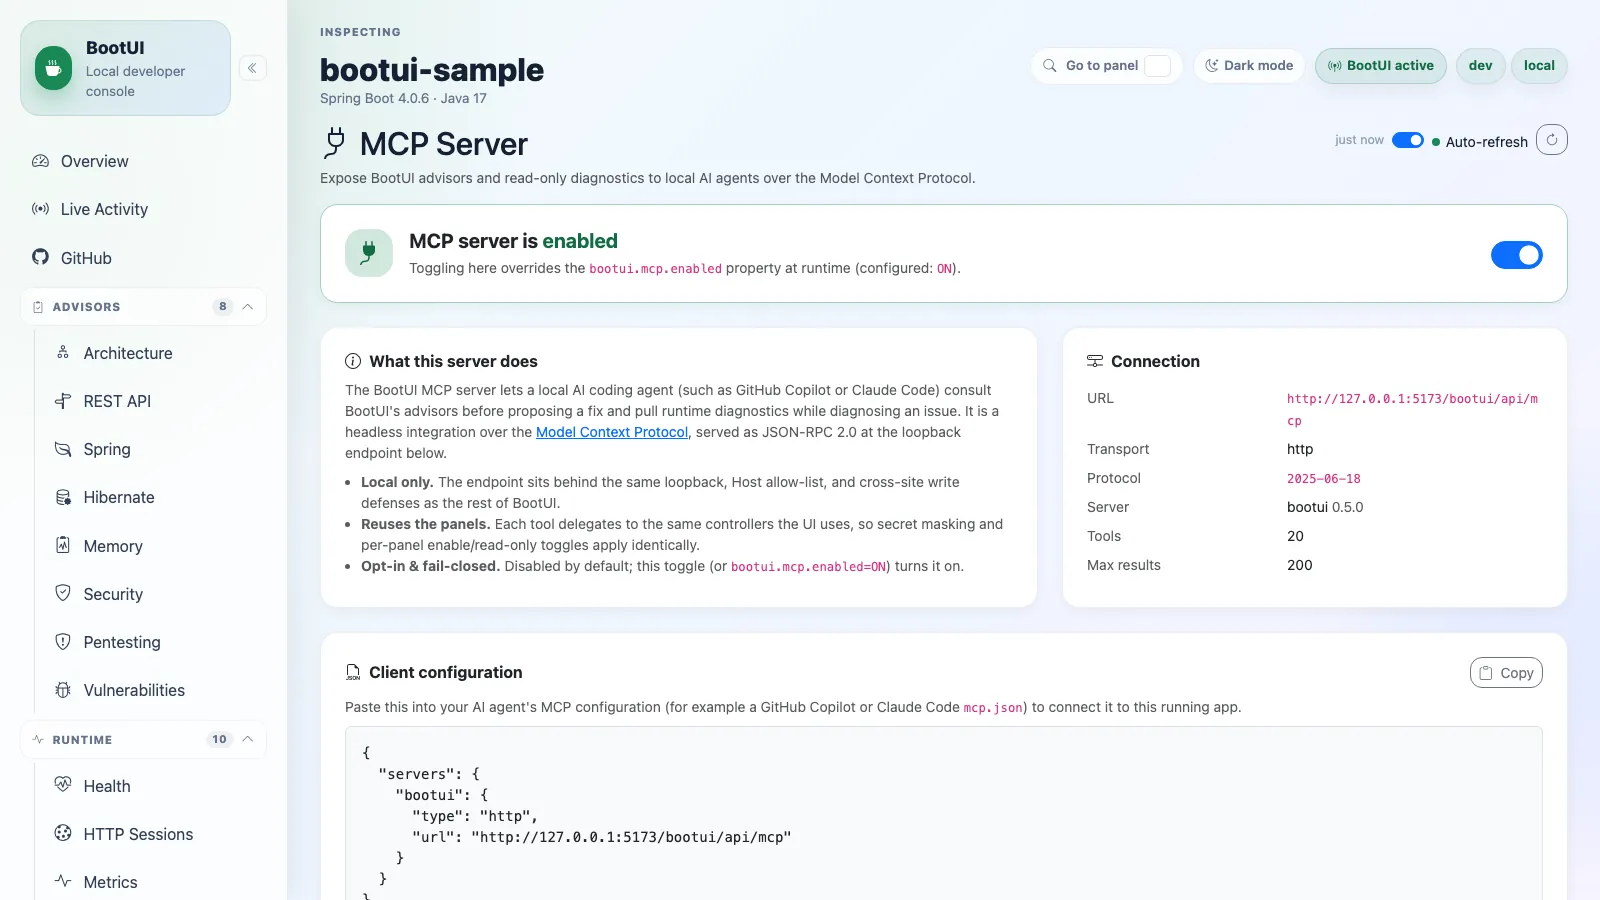
On Spring Boot WebFlux the panel is available too. A reactive tool catalog binds the WebFlux-specific Live Activity, Exceptions, Security Logs, SQL Trace, and Log Tail controllers while reusing the shared controllers for the rest of the surface. It advertises the same tools as the servlet adapter except security_scan, because the Security advisor itself is not yet available on WebFlux. The JSON-RPC transport, runtime toggle, panel/read-only gating, payload/concurrency limits, and response envelopes are otherwise identical across all three adapters.
DevTools
The DevTools panel reports Spring Boot DevTools availability, LiveReload status, and restart support. Restart actions are shown only when available and require explicit confirmation before execution. When DevTools is on the classpath but the LiveReload server is not running, the panel shows a tip to set spring.devtools.livereload.enabled=true (Spring Boot 4 disables LiveReload by default).
The LiveReload card also reports how many browsers are currently connected to the LiveReload server. Triggering a reload only reaches those connected clients — Spring Boot does not inject livereload.js, so a browser needs the LiveReload extension (or the script) to connect on port 35729. When no clients are connected the panel warns that triggering has no visible effect, and the trigger action returns that warning instead of a misleading success.
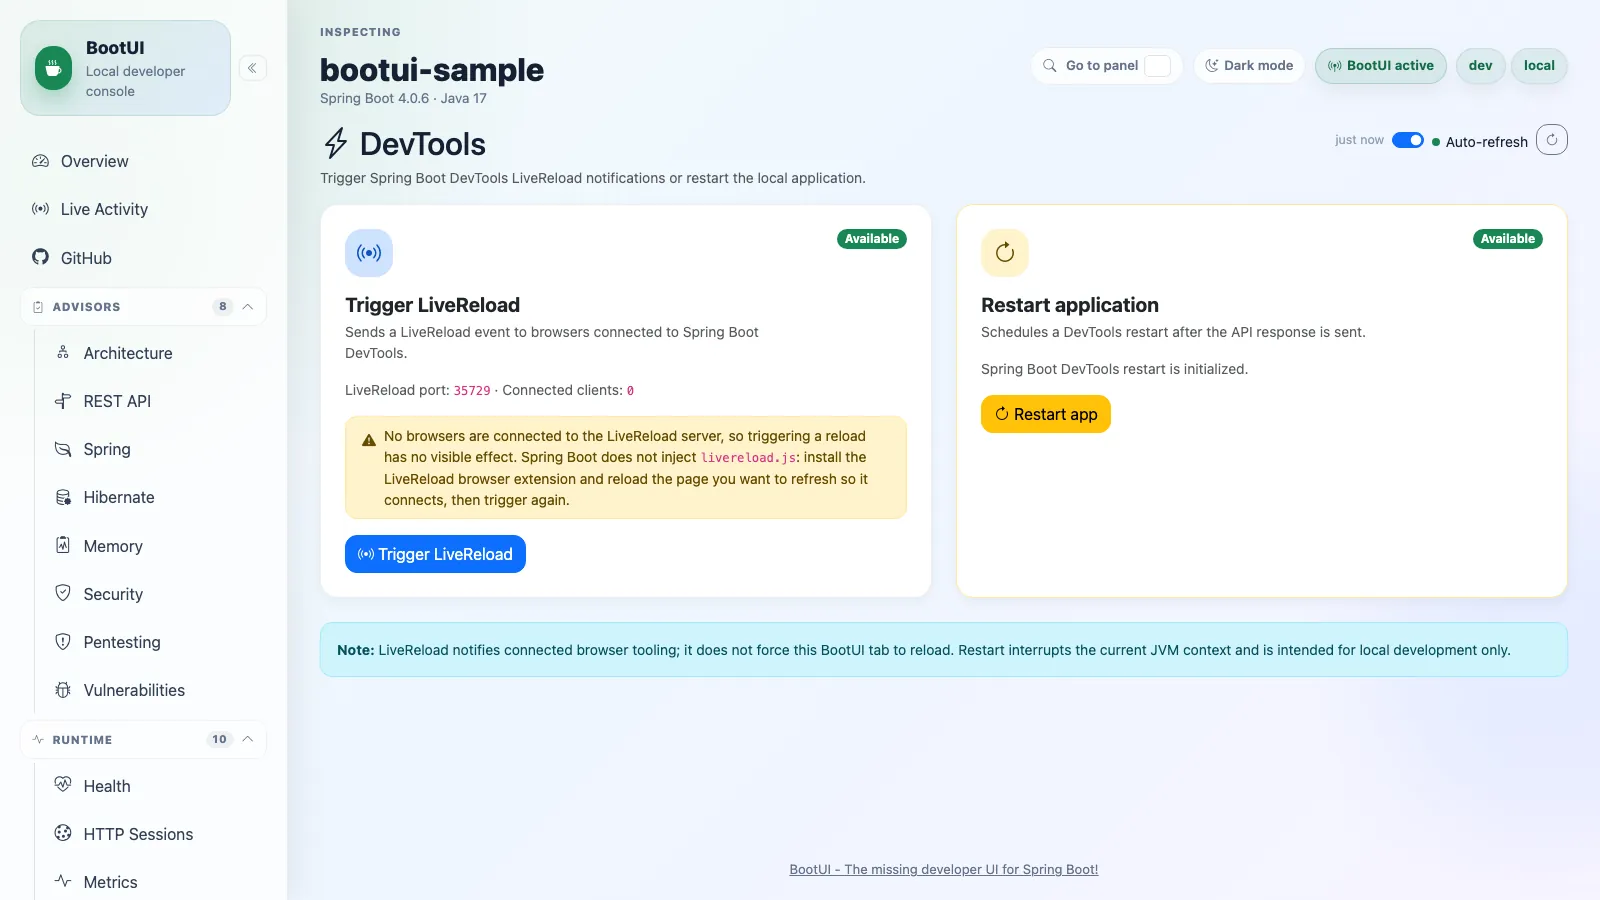
Dev Services
The Dev Services panel surfaces local development services discovered from Docker Compose snapshots, Testcontainers beans, and service connection metadata. It masks sensitive connection information, can show bounded logs for supported services, and shows restart controls only for supported Testcontainers services when bootui.dev-services.restart-enabled=true. To keep opening the panel side-effect free, BootUI skips lazy, prototype, or otherwise uninitialized service beans that would need to be created just for inspection and reports those skips as warnings in the panel.
Masking scope: BootUI masks discovered connection details (for example credentials embedded in a JDBC URL or connection properties) before they reach the browser. Raw container log output is streamed verbatim, bounded by
bootui.dev-services.log-tail-bytes, and is not scanned for secrets — a service that prints credentials to its own logs will surface them in this panel. This is consistent with BootUI being a local-only, loopback-restricted developer console.
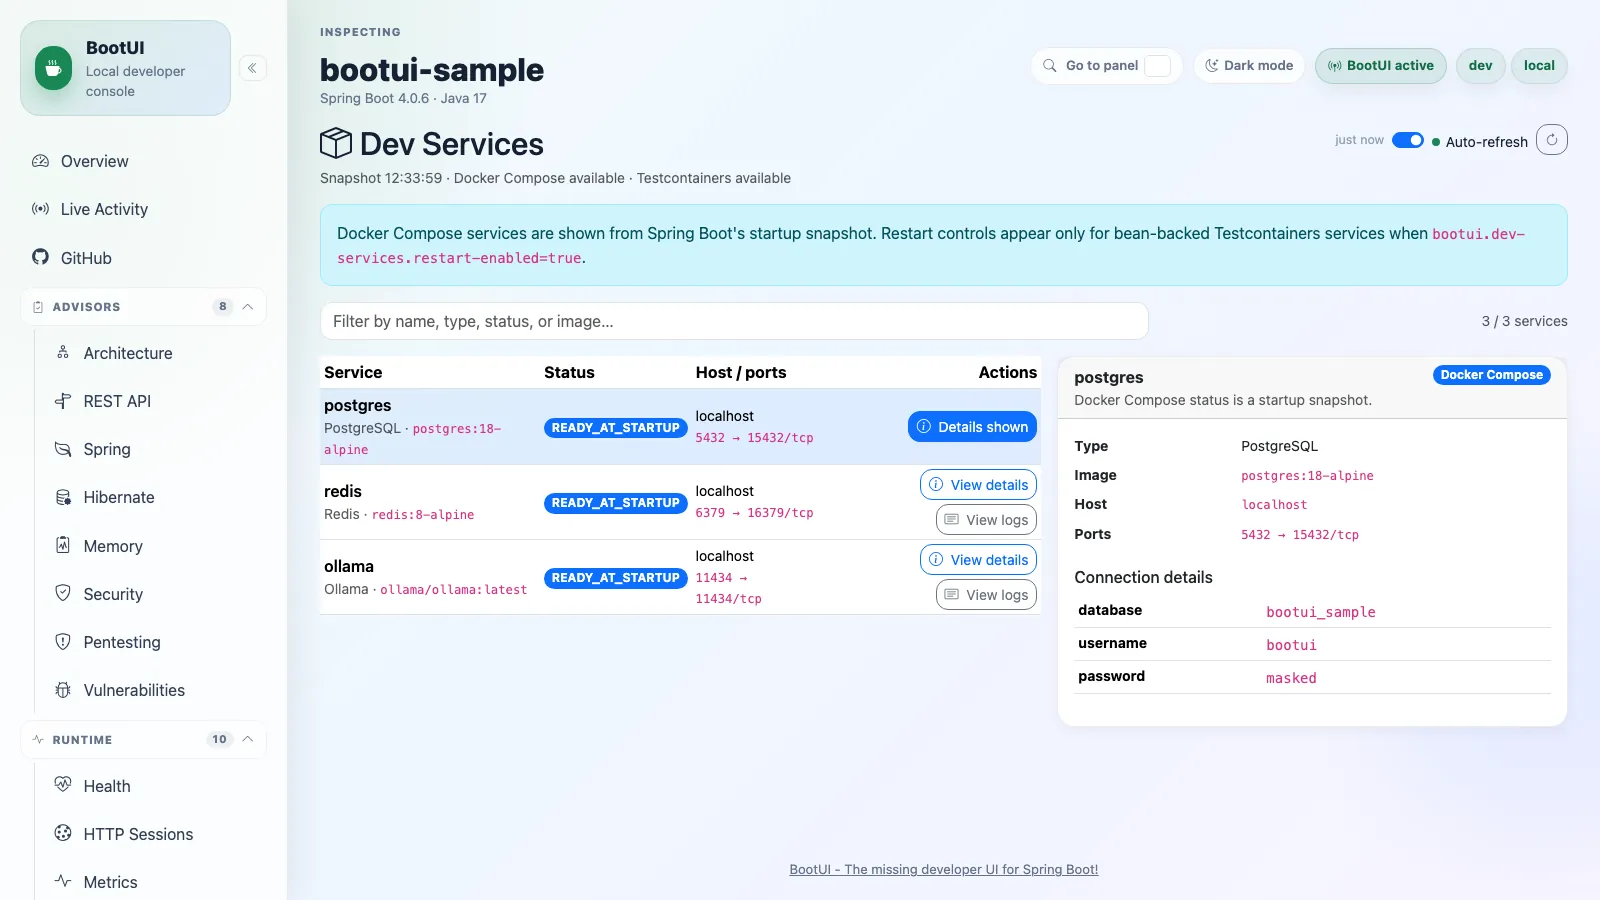
On Quarkus, the Dev Services panel reports the framework's native Dev Services (auto-started dev/test containers such as databases, Kafka, or Redis). The list is captured from the build-time DevServicesResultBuildItem snapshot via a recorder + synthetic bean: each entry shows the service name, container id, and configuration injected by the container, with secret-bearing config values masked. Live logs and restart are managed by Quarkus itself, so those controls are unavailable on Quarkus. DevTools is reported not applicable on Quarkus, which uses built-in dev-mode live reload instead of a Spring Boot DevTools restart bridge.
Copilot
The Copilot panel surfaces sanitized signals from local GitHub Copilot CLI sessions. It reads the session directories and events.jsonl files Copilot CLI writes under ~/.copilot/session-state/ (configurable via bootui.copilot.session-state-dir) and aggregates recent activity into a clean dashboard: active sessions, total sanitized events, input/output token usage when the local session logs include it, failures, 24-hour activity, 7-day activity, event category mix, top tools, model usage, and recent sessions. The session explorer remains available for drilling into tool calls, edits, reads, searches, shell commands, web/docs lookups, MCP tool calls, hook callbacks, skills, sub-agents, and ASK/intent/plan calls. To keep large local histories responsive, the session explorer returns the most recent bootui.copilot.max-sessions sessions by default, while bootui.copilot.max-parsed-sessions caps how many recent session files are parsed and retained in JVM heap. The activity charts default to token usage, with input tokens shown in blue and output tokens shown in red, and can be toggled back to sanitized events/failures. Selecting a chart hour or day filters the explorer to sessions active during that window. Failure lists use retained failure events and include sanitized tool/type context. Each event row shows only an allowlisted summary - raw prompts, tool arguments, command output, and diffs are deliberately excluded. The per-event "Reveal raw" action is an explicit, local-only escape hatch that returns the source JSON; it can be disabled with bootui.copilot.allow-raw-reveal=false and is also blocked when bootui.expose-values=METADATA_ONLY. The sidebar dims the panel when no session-state directory is found. Data is read-only - BootUI never modifies anything under ~/.copilot/. The panel uses the same header refresh button and visibility-aware auto-refresh toggle as the other live data panels, while the backend watches the directory through a Java NIO WatchService thread. Inspired by copilot-mission-control, which pioneered this dashboarding of Copilot CLI session state.
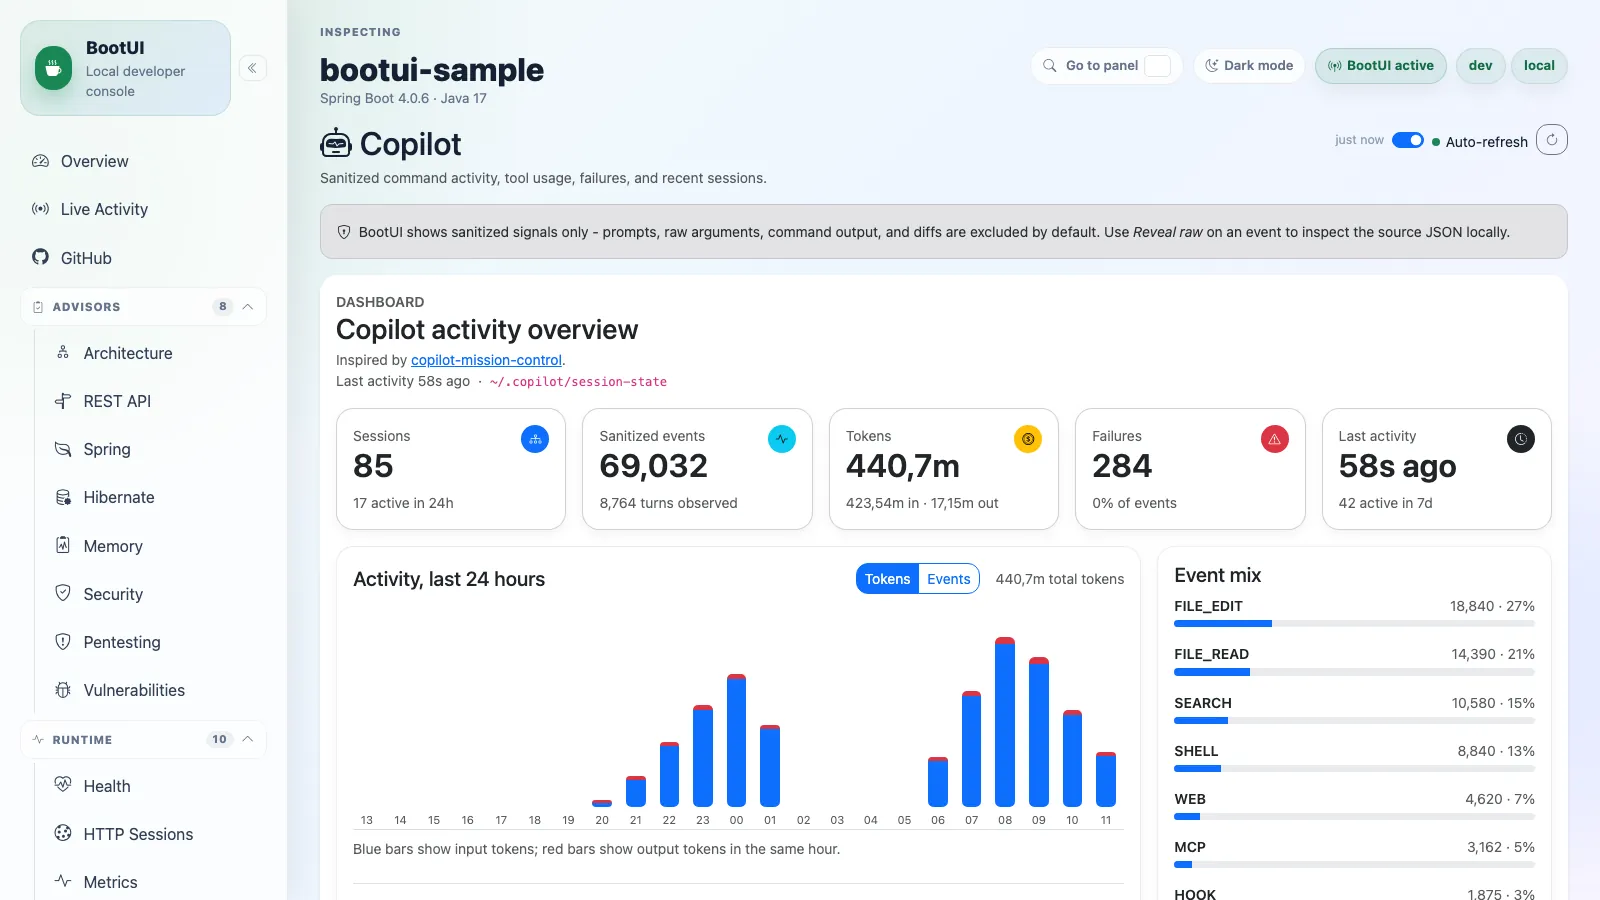
Claude Code
The Claude Code panel mirrors the Copilot dashboard for local Claude Code project logs. It reads JSONL session files under ~/.claude/projects/ (configurable via bootui.claude-code.session-state-dir) and surfaces sanitized activity trends, tool usage, model usage, input/output token usage, failures, recent sessions, and per-session event drill-downs. Its activity charts use the same token-by-default view as the Copilot panel, with an events toggle for sanitized activity and failures. BootUI treats Claude Code logs as especially sensitive: prompts, assistant text, tool inputs, file contents, command output, and tool-result content are excluded from normal responses. bootui.claude-code.max-parsed-sessions caps how many recent JSONL files are parsed and retained in JVM heap. The raw JSONL reveal endpoint is disabled by default with bootui.claude-code.allow-raw-reveal=false; enabling it is an explicit local-only escape hatch and is still blocked when bootui.expose-values=METADATA_ONLY. The sidebar dims the panel when no Claude Code projects directory is found. Data is read-only - BootUI never modifies anything under ~/.claude/. Because Claude Code writes sessions inside per-project subdirectories, BootUI refreshes this panel through the shared visibility-aware auto-refresh polling used by the other live data panels.