Database
These panels read the database your application is already connected to. The rule-based scans live in the Database and Hibernate advisors.
Database Connection Pools
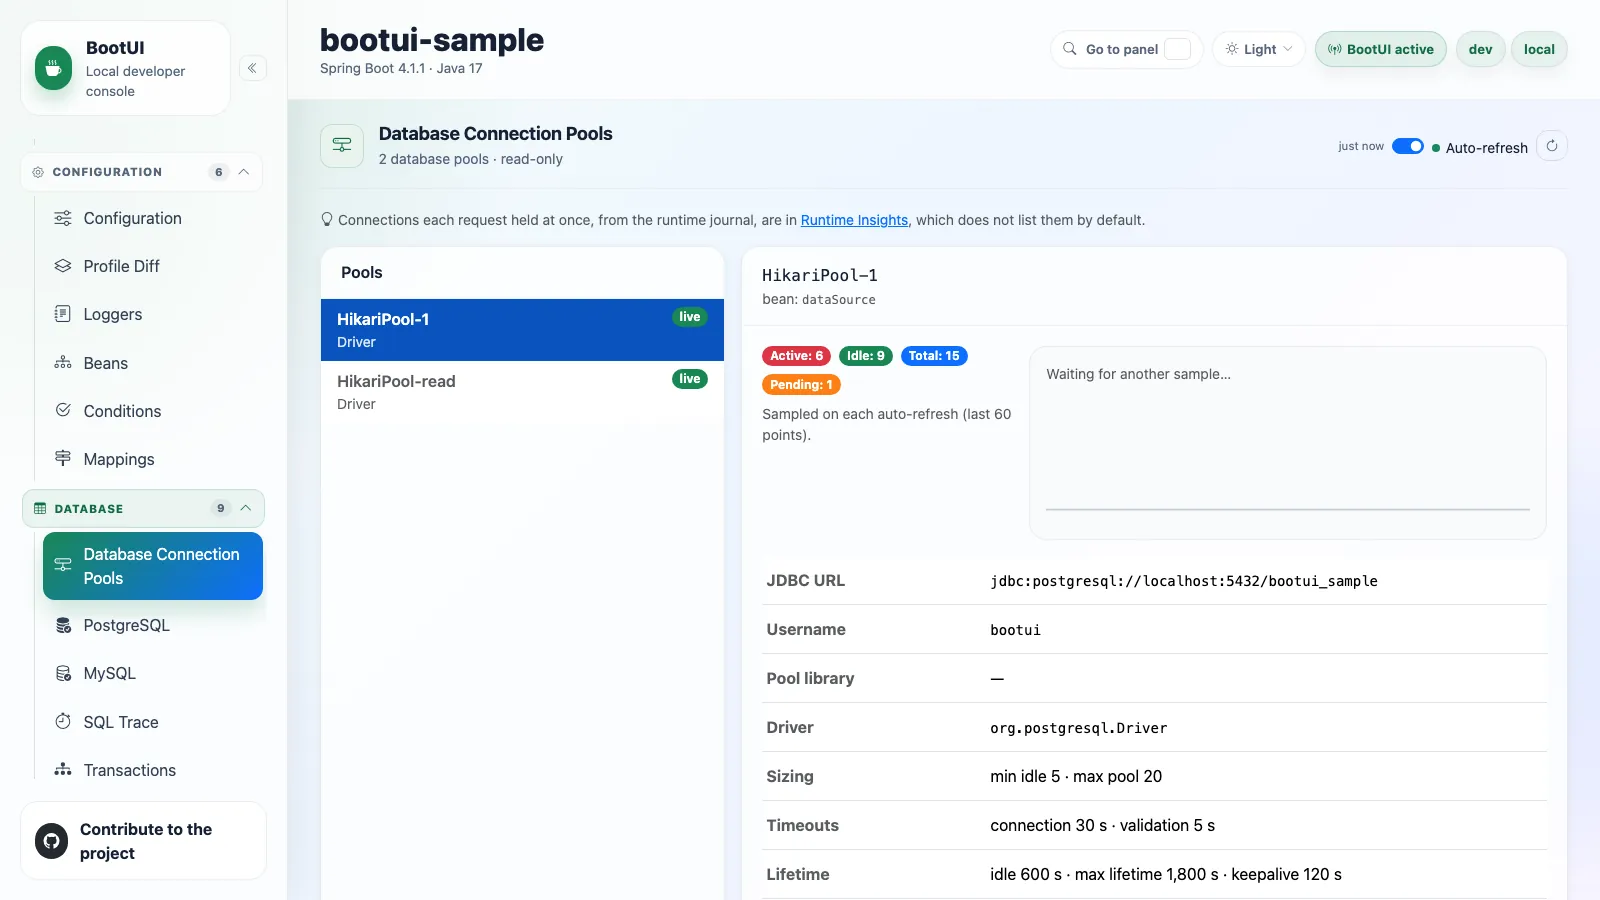
The Database Connection Pools panel inspects supported JDBC pool beans. It is read-only: it never executes SQL, borrows a connection, or resizes a pool, and it fails closed when no supported pool is present.
For each pool it shows the identity and library, the masked JDBC URL and username, the driver, the minimum and maximum sizing, and the timeout and lifetime settings. Closed and uninitialized pools carry an unavailable reason. A live chart polls bounded snapshots of active, idle, total, and pending connections every two seconds.
The connections each request held at once are in Runtime Insights (connections-per-request); this panel links to them.
On Quarkus: served over Agroal
The panel is served over Agroal instead of HikariCP and looks the same. Pool metrics require quarkus.datasource.jdbc.metrics.enabled=true; with metrics disabled the configuration still renders but the live snapshot is marked unavailable. Pool library reads Agroal. Settings Agroal does not expose (validation timeout, keepalive interval, read-only flag) render as "—"; a maximum lifetime of 0 means no limit.
PostgreSQL
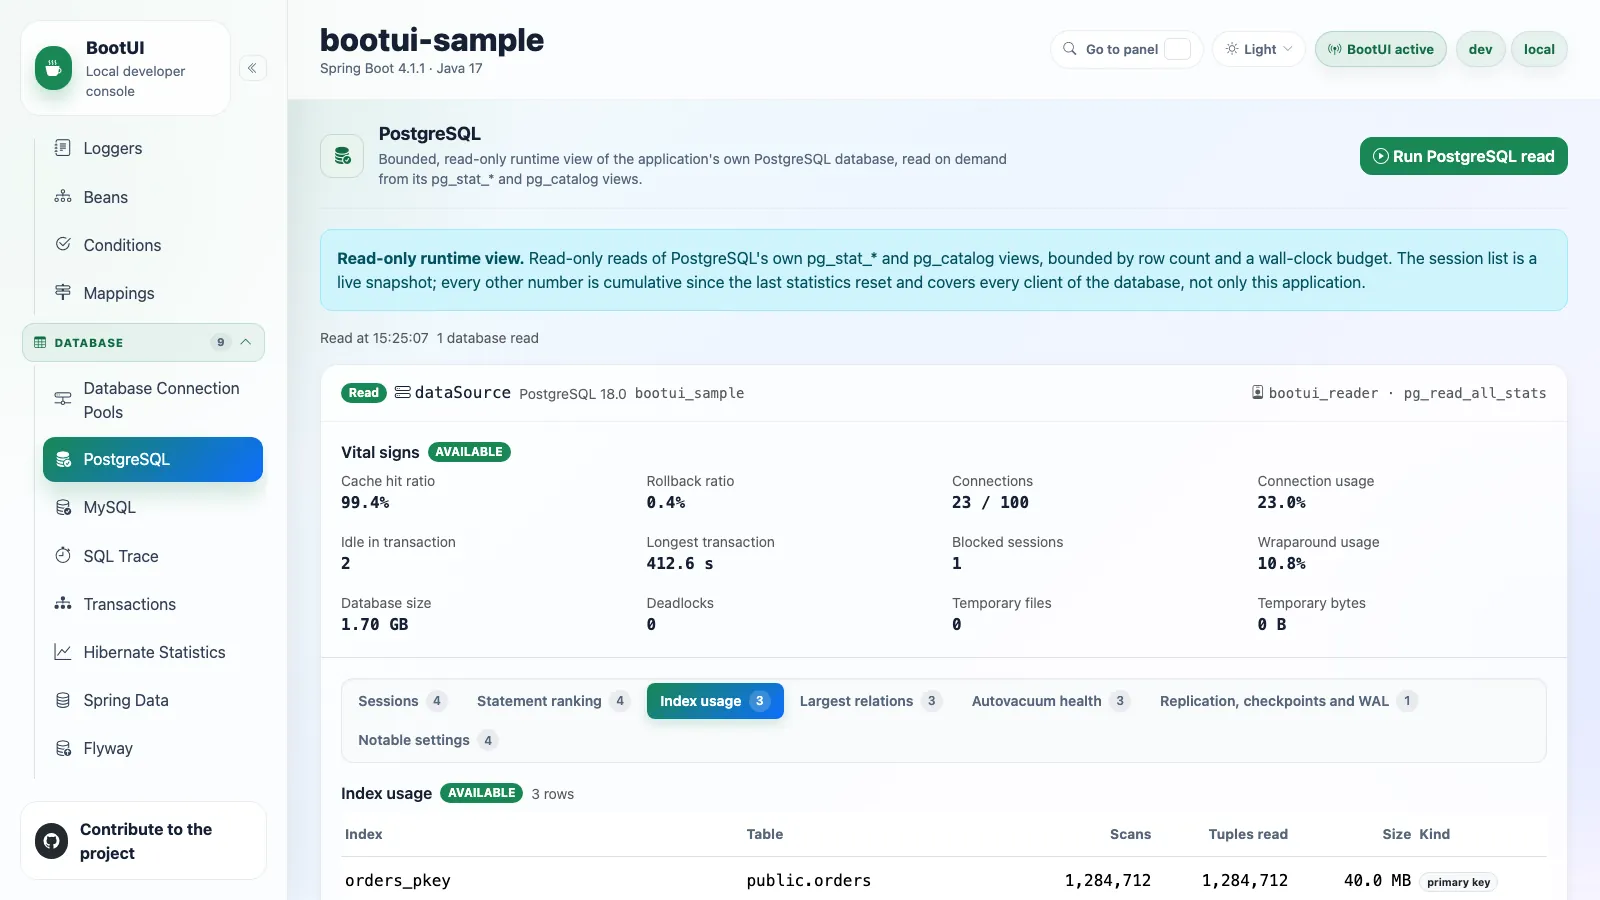
The PostgreSQL panel reports what PostgreSQL itself says about the database your application is connected to. It reports the server's own numbers and leaves the judgement to you: there is no rule catalogue, severity, or score.
Each datasource is one card. Its vital signs stay in view while the other sections are tabs, and each tab carries its row count, or a skipped or failed marker with a reason, so a missing extension never looks like an empty table.
Reads are explicit. Opening the panel shows the last report; PostgreSQL is queried when you choose Run PostgreSQL read. A second read adds a short list of what changed since the previous one, kept in memory only.
| Section | What it shows |
|---|---|
| Vital signs | Cache hit ratio, rollbacks, connections, transaction-id age, database size, and deadlocks. |
| Sessions | A live snapshot of pg_stat_activity: state, wait event, blocking pids, transaction age, and statement. |
| Statement ranking | The top normalized statements from pg_stat_statements, ranked by total execution time. |
| Index usage | Which indexes the server actually reads. |
| Largest relations | Relation size and access shape, including sequential and index access. |
| Autovacuum health | Dead tuples, last (auto)vacuum and analyze, and a "due" estimate. |
| Replication, checkpoints and WAL | Connected replicas with state and lag, plus checkpoint and WAL activity. |
| Notable settings | A curated allow-list of operational settings. |
Apart from Sessions, every section is cumulative since the last statistics reset. The panel is available on all three stacks when a PostgreSQL datasource is configured; rendering the sidebar contacts no database. Use a read-only role that belongs to pg_monitor where you can.
How it relates to the Database advisor and SQL Trace
- Database advisor checks physical schema structure from metadata and vendor catalogs.
- SQL Trace shows statements this JVM recently issued.
- PostgreSQL reads PostgreSQL's own cumulative
pg_stat_*andpg_catalogviews, which include work from every client of the database.
Safety and bounds
The panel runs one read-only transaction per datasource, pinning statement_timeout to 5 seconds, lock_timeout to 2 seconds, and the read budget to 15 seconds. Every statistics query runs in its own savepoint, so one error does not abort the others.
BootUI refuses a connection already in manual-commit mode (for example spring.datasource.hikari.auto-commit=false) before issuing SQL, and never commits or rolls back that connection.
List sections are capped per datasource. These keys and defaults are the same on all three stacks:
bootui.postgresql.max-sessions=100
bootui.postgresql.max-statements=100
bootui.postgresql.max-indexes=500
bootui.postgresql.max-tables=200
bootui.postgresql.max-vacuum-tables=200
bootui.postgresql.max-replicas=10
bootui.postgresql.max-settings=40
Values must be positive integers below 2147483647; zero does not mean unlimited, and invalid values are rejected. Restart after changing a limit. See the property reference.
truncated means a row cap was reached; exhausting the time budget produces an explicit section reason and keeps the rows already read. A top-100 statement ranking is an expected cap and shows one informational note, not a warning. The API, MCP, and CLI report PARTIAL with truncated=true and list capped sections in limitations.
The change baseline is never written to disk, and a section that could not be read keeps its earlier value. The Notable settings list excludes statement_timeout, lock_timeout, and idle_in_transaction_session_timeout, because BootUI overrides them for its own read.
Values follow the global exposure policy. Session and statement text is redacted, masked, and truncated: under MASKED or METADATA_ONLY, string literals and dollar-quoted bodies are replaced, and session and replica client addresses are masked under METADATA_ONLY. Error messages from failed reads are redacted the same way.
Permissions and missing visibility
Without pg_monitor, PostgreSQL silently restricts its views:
| View | Restriction | Consequence |
|---|---|---|
pg_stat_activity | Removes rows of backends the role does not own | The session list shrinks to BootUI's own connections |
pg_stat_statements | Replaces text with <insufficient privilege> | Statement ranking loses its statements |
pg_stat_replication | Empties state, sync state, and lag | The replica count stays right; the rest degrades |
BootUI probes pg_read_all_stats membership and marks the affected sections partially read. Statement ranking also requires the pg_stat_statements extension. On a standby, the replica list and primary-relative lag are not read (replication.replicasAvailable=false). A datasource that declares no readable URL keeps the panel available whenever the PostgreSQL driver is on the classpath; a non-PostgreSQL datasource is then skipped with a diagnostic.
The autovacuum "due" estimate uses the settings the server would apply to each relation, including per-table reloptions. It models only the dead-tuple trigger and reads pg_stat_user_tables, which the section states.
Try it with the sample application
The Spring MVC sample has a docker-postgresql profile that preloads pg_stat_statements. Run bootui-spring-sample-app/run-local-postgresql.sh for a lightweight PostgreSQL-and-Redis stack.
MySQL
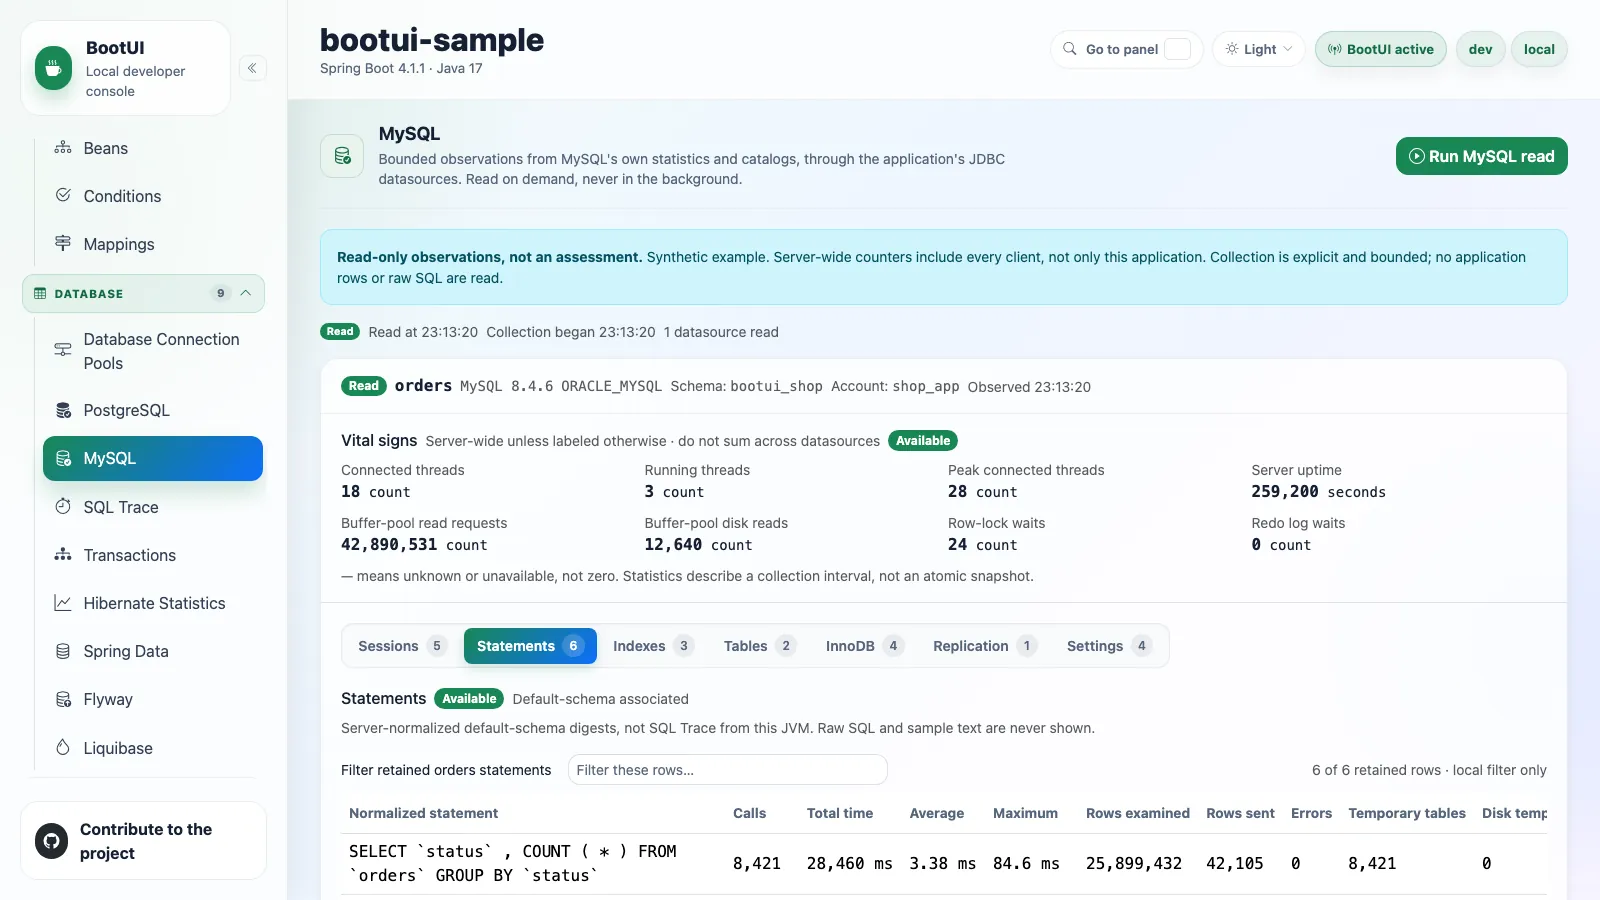
The MySQL panel is the operational sibling of the PostgreSQL panel. It reports what the connected server says, from MySQL's own Performance Schema and Information Schema. That complements the Database advisor's schema checks and SQL Trace's view of the statements this JVM issued.
Each datasource is one card, with vital signs in view and the other sections as tabs. A section that could not be read names its reason, so incomplete evidence never reads as an idle server. There are no grades, severities, or recommendations.
Reads are explicit. Opening the panel shows the last in-memory report; MySQL is queried when you choose Run MySQL read.
| Section | What it shows |
|---|---|
| Vital signs | Server-wide uptime, connections, buffer-pool and lock/log counters. |
| Sessions and blocking | Sessions with state age and optional transaction age, plus row-lock relationships and metadata waits. |
| Statement ranking | Normalized digests ranked by total execution time, with calls, durations, rows examined and sent, and errors. |
| Index handler operations | Which indexes the server actually uses, for the selected schema. |
| Table estimates | Engine, estimated rows and storage, and table I/O. |
| InnoDB | Allow-listed buffer, log-wait, lock, deadlock, and history-list evidence. |
| Replication | Receiver and applier channel state, coordinator errors, and worker summaries. |
| Settings | A fixed safe allow-list of global settings. |
Every value carries its scope (server-wide, selected schema, or default-schema-associated), and unknown values stay unknown instead of being shown as zero. The panel works on all three stacks with JDBC datasources, including named ones; R2DBC-only applications are unavailable.
Tested compatibility
Oracle MySQL 8.4 LTS and 9.7 LTS are the tested server lines, with Connector/J 9.7.0 and HikariCP on Spring and Connector/J 9.6.0 and Agroal on Quarkus. Other Oracle MySQL versions are read with an informational "not a tested server line" diagnostic. Other flavors, such as Percona Server, are skipped.
MariaDB is read but not supported
A MariaDB server reached through MySQL Connector/J (jdbc:mysql://...) is read on a best-effort basis: the datasource carries an Unsupported badge and no automated test covers it. MariaDB Connector/J (jdbc:mariadb:) is not offered the panel. On MariaDB, replication receiver state is unknown, no counter comparison is computed, and reads are usually Partial until performance_schema_instrument='wait/lock/metadata/sql/mdl=ON' is set. MariaDB before 11.1 fails closed because its read-only session guards cannot be established.
Try it with the sample application
The Spring MVC sample has a docker-mysql profile that enables statement instrumentation and provisions the diagnostic grants. Run bootui-spring-sample-app/run-local-mysql.sh for a lightweight MySQL-and-Redis stack.
Read and report contract
| Surface | Cached evidence, no connection or SQL | Explicit collection |
|---|---|---|
| REST | GET /bootui/api/mysql | POST /bootui/api/mysql/read |
| MCP | get_mysql_report | mysql_read |
| CLI | bootui db mysql report | bootui db mysql read |
Over MCP and the CLI, the explicit read answers with a summary and the cached report returns the rows. Neither operation accepts SQL, a schema selector, or a server address; collection uses the application's existing datasources and credentials.
Global bootui.read-only or bootui.panels.mysql.read-only blocks the explicit read because it initiates external work; cached reads remain allowed. Disabling bootui.panels.mysql.enabled blocks both. An overlapping read is refused, not queued.
Reports are NOT_READ, READ, PARTIAL, ERROR, or DISABLED. READ means applicable sections completed within their scope, not that the database is healthy. A section is AVAILABLE, SKIPPED, or FAILED, with a reason when evidence is incomplete. The cache holds sanitized data; changing the exposure policy invalidates it and requires a new explicit read.
Scope and precision
- Server evidence can include other applications; do not add server counters from multiple pools on one instance.
- Selected schema sections are skipped when no schema is selected; BootUI never enumerates every database.
- Default-schema-associated sessions and digests are not an inventory of every statement touching that schema.
- Unknown values are
null, not zero. Large counters, byte sizes, and identifiers are exact decimal strings in JSON; do not coerce them through a JavaScriptNumber. - The first read has no invented rates. Comparisons need a compatible datasource, server identity, and counter provenance; a restart or server change invalidates the baseline. Nothing is persisted to disk.
- Statement ranking has normalized digests only, never raw SQL. Index handler statistics are not query counts, and "no recorded reads" is not advice to drop an index. Table estimates can be cached; BootUI never runs
COUNT(*). Replication evidence has no end-to-end lag.
Safety and bounds
The execution bounds are a 15-second cooperative total read budget, a 5-second server SELECT limit (MAX_EXECUTION_TIME, or SET STATEMENT max_statement_time on MariaDB), a 2-second metadata-lock wait limit, and 400 characters of displayed statement text. The borrowed connection also gets a JDBC network timeout of at most 7 seconds. BootUI uses neither Statement.setQueryTimeout nor Statement.cancel, avoiding Connector/J's auxiliary KILL QUERY connections. These are not hard end-to-end deadlines; connection-acquisition waits are controlled by the application pool.
If performance_schema.global_status is unreadable, BootUI falls back to SHOW GLOBAL STATUS filtered to 17 fixed safe names.
The seven startup row caps, identical across the three JDBC adapters, are:
bootui.mysql.max-sessions=100
bootui.mysql.max-statements=100
bootui.mysql.max-indexes=500
bootui.mysql.max-tables=200
bootui.mysql.max-lock-waits=100
bootui.mysql.max-replication-channels=10
bootui.mysql.max-settings=40
Each applies per datasource. Values must be positive integers below 2147483647; invalid values fail startup, and zero is not unlimited. Restart after changing a cap. See the property reference.
truncated=true means a BootUI row cap omitted results, not a failed query. The UI shows row caps as neutral Limited labels; permission problems, timeouts, and unavailable instrumentation remain warnings or errors.
Collection sets transaction_read_only=1, starts START TRANSACTION READ ONLY, and verifies the server setting; it avoids Connection.setReadOnly. Manual-commit connections are refused before any SQL. Afterward, BootUI rolls back only its own transaction and restores the auto-commit, session settings, and network timeout. If restoration and abort both fail, the handle is quarantined and further collection is disabled until the pool and BootUI restart.
No application rows, LOCK_DATA key values, QUERY_SAMPLE_TEXT, PROCESSLIST_INFO, or TRX_QUERY are selected. Only normalized digest text is exposed, after masking, credential redaction, the exposure policy, and length bounds; metadata-only mode withholds statement text and sensitive addresses. Raw JDBC URLs, arbitrary server errors, replication secrets, and variable dumps are excluded in every mode. There are no kill controls, SQL console, query plans, DDL, or controls to change server configuration.
Availability and permissions
Sidebar discovery reads local declarations only, never a database; the explicit read verifies the connected server and reports unsupported targets. Routing datasources describe the actual connected server. On Quarkus, use quarkus-jdbc-mysql and a JDBC datasource; a reactive client alone does not qualify.
Use the application's existing account and grant only the visibility the operator approves. There is no single pg_monitor equivalent, and BootUI never enables instruments or resets statistics. Do not grant SUPER or all of performance_schema.* just to make the panel complete.
| Optional visibility | What to authorize |
|---|---|
| Status and settings | performance_schema.global_status is usually readable without a grant; otherwise the fixed SHOW GLOBAL STATUS fallback is used. Settings use fixed @@global expressions. |
| Session state | SELECT on performance_schema.threads. This exposes other users' thread rows without PROCESS, so it is a real permission decision. |
| Blocking | SELECT on performance_schema.data_lock_waits, data_locks, and metadata_locks. On MariaDB, PROCESS for information_schema.INNODB_LOCK_WAITS, INNODB_LOCKS, and INNODB_TRX. |
| Statement ranking | SELECT on performance_schema.events_statements_summary_by_digest, with digest collection and timing enabled. |
| Table and index activity | SELECT on performance_schema.table_io_waits_summary_by_table and table_io_waits_summary_by_index_usage, with matching object instrumentation. |
| Instrumentation explanation | SELECT on performance_schema.setup_consumers, setup_instruments, and setup_objects. Denied probes leave state unknown, not enabled. |
| Replication | SELECT on the replication_connection_status and replication_applier_status* tables in performance_schema. |
| Additional InnoDB detail | Optional global PROCESS for information_schema.innodb_trx and innodb_metrics. |
Uninstrumented or unknown objects keep their catalog metadata, but affected activity counters are withheld and explained per section, never shown as zero. An empty metadata-lock list with disabled instrumentation cannot establish absence.
When evidence is missing
| Situation | Interpretation and next step |
|---|---|
| No supported JDBC datasource | Check the driver and datasource declarations. Do not create another monitoring pool. |
| Permission denied | Readable sections are kept. Review the named source with the operator and the role active on this connection. |
| Performance Schema, digests, or timing disabled | Missing evidence is not an idle workload. BootUI never enables anything. |
| Manual-commit pool default | Collection is refused to protect application transactions; do not change transaction settings to silence it. |
| Timeout or acquisition wait | Check section reasons and the pool and network timeouts. A timeout is not truncation. |
| Row cap only | Read the retained top-N window. Raising a cap needs a restart and a new read. |
SQL Trace
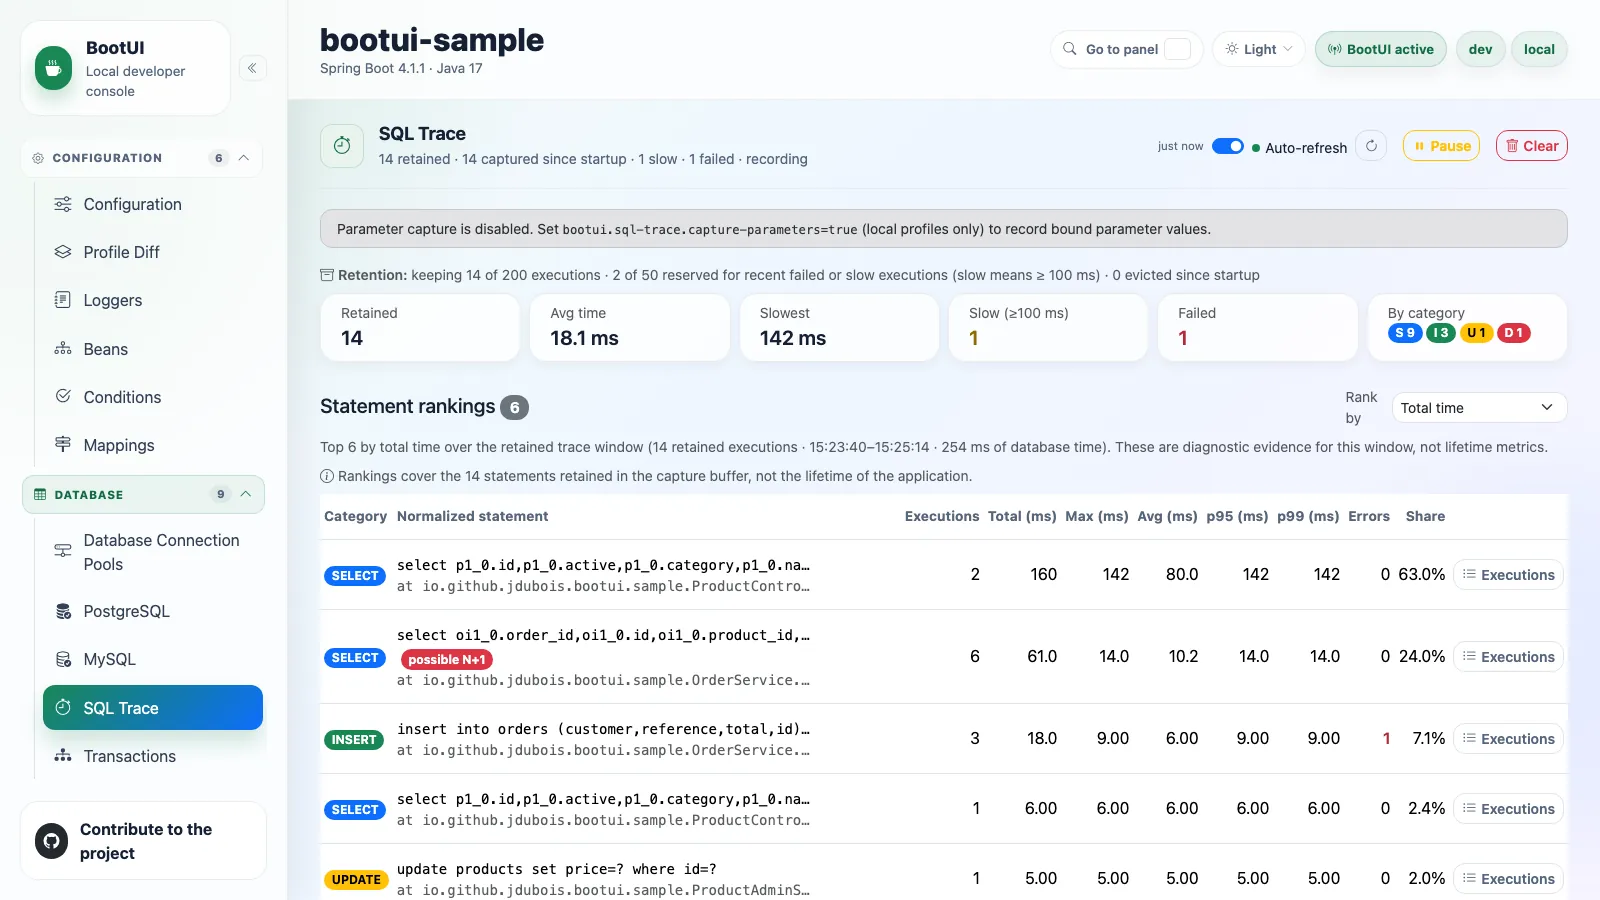
The SQL Trace panel shows the SQL statements your application recently executed. Each row expands to the full statement, bound parameters, statement type, connection id, executing thread, call site, and error.
Executions are kept in a bounded buffer, most recent first, with aggregate stats: total, average, and maximum time, slow-query and failure counts, per-category counters, and evictions. A slow-query threshold highlights expensive statements. Local-only Pause, Resume, and Clear actions stop recording or empty the retained window. Pausing stops only this panel's buffer: the runtime journal keeps recording. Over MCP and the CLI, the controls answer with a compact acknowledgement.
A share of the buffer, 25% by default (bootui.sql-trace.reserved-share-percent), is reserved for the most recent failed and slow executions, so a burst of fast queries evicts routine executions first; see Failure-preserving retention.
Statements are timed in nanoseconds and recorded in microseconds (durationMicros), and every aggregate is reported in fractional milliseconds, so sub-millisecond statements still rank.
Repeated SELECTs that look like an N+1 access pattern are flagged once they reach bootui.sql-trace.n-plus-one-threshold. A flagged group lists the distinct call sites (class, method, line), so you can go straight to the repository or service method causing the repetition.
How capture works
BootUI wraps each DataSource bean with a JDK dynamic proxy and records the SQL text, statement type, category (SELECT, INSERT, UPDATE, DELETE, DDL, OTHER), duration, affected rows, batch size, connection, executing thread and its kind (WORKER, VIRTUAL_THREAD, EVENT_LOOP, REACTOR_SCHEDULER, OTHER), the call site when enabled, and any failure. On Spring MVC and Quarkus, each statement also records the request phase it ran in: FILTERS, HANDLER, or RESPONSE (where lazy loading surfaces). Spring WebFlux records no phase.
A Spring DataSource wrapper is never replaced; when it owns the only reference to a pool (for example LazyConnectionDataSourceProxy), the pool inside is traced in place. Wrapping fails open: a DataSource that cannot be proxied is left untouched. On the JVM the proxy also advertises the vendor interfaces of the original bean, such as Oracle UCP's PoolDataSource, so by-type injection keeps working.
Rankings
Above the execution list, the panel ranks the retained window twice. Both tables deep-link into the filtered list below.
Statement rankings aggregate executions by normalized statement: literals and bind markers collapse to ? and IN (…) lists fold, so equivalent executions group together without exposing a bound value. Rank by cumulative duration, slowest execution, count, average, error count, p95, or p99; each row also shows p50, p95, p99 and its share of retained database time. Most frequent statements is the fallback when rankings are unavailable and keeps literal values.
Database time by request route attributes executions back to the requests that issued them, with requests, executions, distinct statements, errors, and share of database time per route; each row expands to that route's top statements.
How route grouping resolves a template
Grouping uses the framework's route template (GET /api/sample/orders/{id}) when available, otherwise matches the path against the application's declared route mappings, and falls back to a masked path (identifier-looking segments become {value}, query string discarded). Matching a declaration is strict, and ambiguous declarations produce no template, because masking alone cannot tell /api/users/alice from a fixed route segment.
Attribution is evidence, not lifetime metrics
Rankings describe only the statements still in the buffer, and the panel states that window inline: retained statements, buffer size, evictions, and the age of the oldest execution. A window that has evicted executions can over-represent failed and slow ones.
Attribution is conservative. It correlates a statement to a request by trace id first, then by serving thread (JVM only), then by time window, each requiring a single unambiguous candidate. Executions that cannot be placed, or that matched several requests equally, go into explicit Unattributed and Ambiguous buckets.
On Spring WebFlux and Quarkus only trace-id and time-window correlation are used. On WebFlux, request evidence needs the OpenTelemetry integration; without it route attribution is reported unavailable while rankings still work.
Privacy and configuration
Parameter bindings are not captured by default. When enabled, they are suppressed under metadata-only exposure and routed through BootUI's masking rules, with an inline warning when shown in clear text. Call sites are code metadata, not bound values, so bootui.sql-trace.capture-call-site (default true) is not privacy-gated.
The panel fails closed when no DataSource bean is wrapped. Tracing, the initial recording state, parameter and call-site capture, buffer size, the slow-query and N+1 thresholds, and truncation limits are configurable under bootui.sql-trace.*. The panel refreshes over Server-Sent Events from /bootui/api/sql-trace/stream; the push carries no data, so masking and exposure rules still apply through the regular endpoint.
GraalVM native images are supported
BootUI registers the tracing proxies as native-image proxy metadata, so SQL Trace works in a native executable. If a proxy cannot be created, the DataSource is left untraced rather than breaking startup.
On Quarkus: JDBC executions and ORM preparations
Capture comes from two feeders: an @Alternative Agroal DataSource wrapping the default pool for manual JDBC, and a @PersistenceUnitExtension Hibernate StatementInspector for ORM SQL of the default persistence unit (named units are not traced), because Hibernate resolves its pool from Agroal's own registry.
The inspector observes preparation only. Those rows stay visible with a report warning, but their compatibility fields (durationMicros: 0, success: true) do not establish an execution or outcome, so they are excluded from statistics, rankings, N+1 badges, and confirmed event-loop blocking. Both feeders are wired in dev and test only, and the inspector never captures bound parameter values.
Transactions
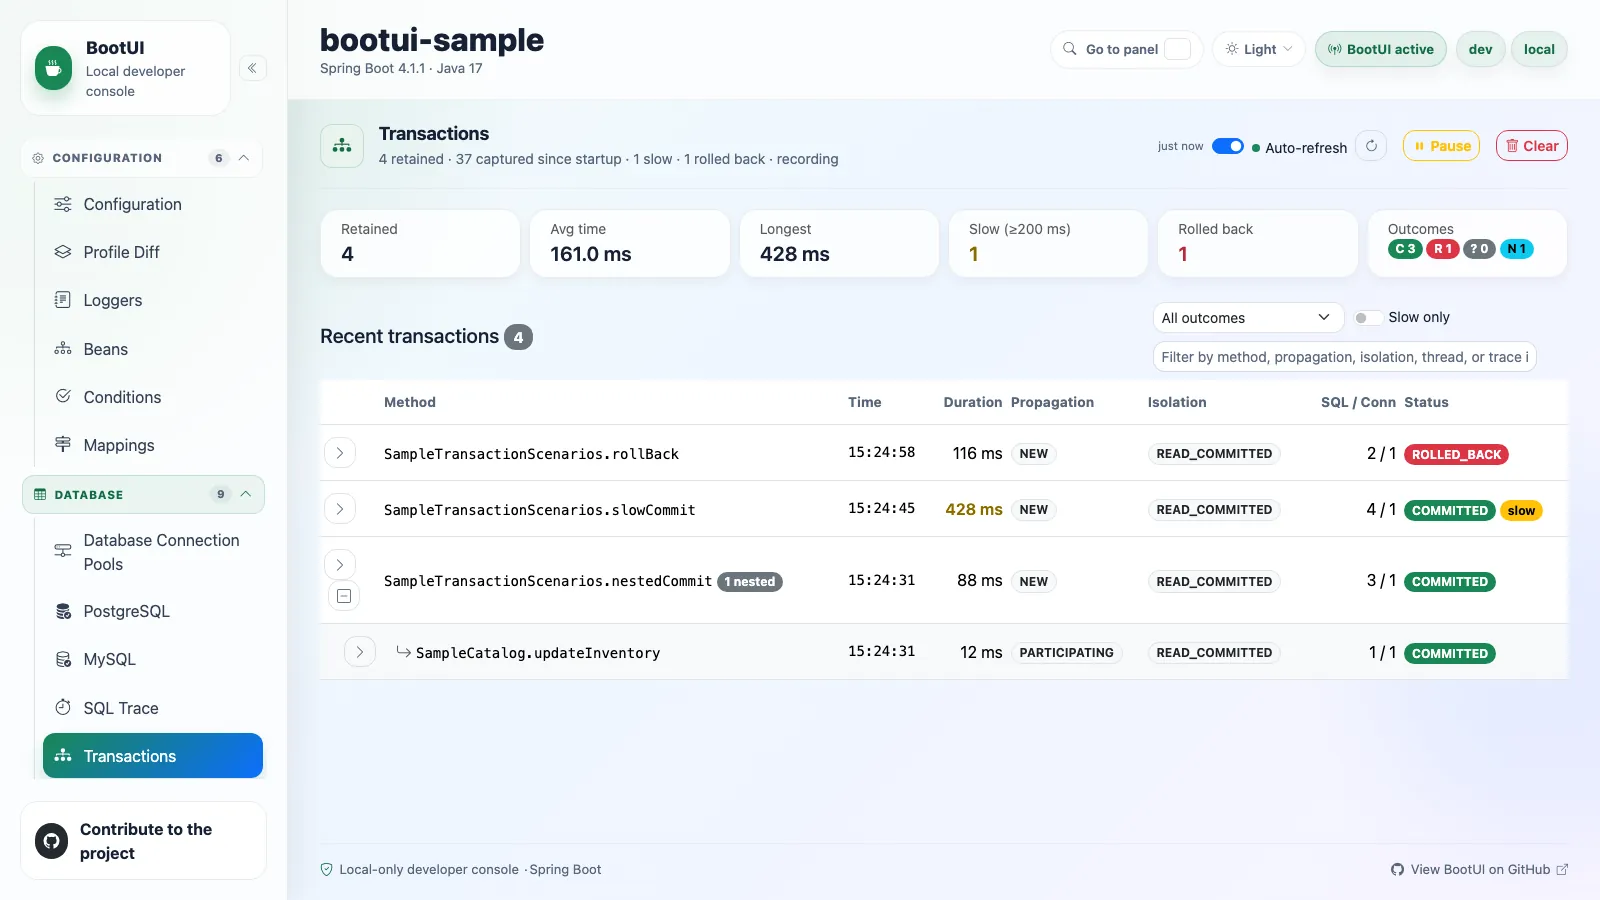
The Transactions panel shows the @Transactional boundaries your application recently ran: begin, commit, and rollback events, captured by BootUI's own listener wiring.
Transactions are kept in a bounded buffer, most recently completed first, with aggregate stats: total, average, and maximum duration, slow and connection-held counts, commit, rollback, and unknown outcomes, and nested count. The panel renders a parent and child tree, and each row expands to its thread, trace id, read-only flag, and any error. Slow and connection-hold thresholds flag transactions worth a closer look. Local-only Pause, Resume, and Clear actions stop recording or empty the buffer; pausing stops only this panel's buffer, and the runtime journal keeps recording.
Transaction metadata (method names, propagation, isolation, threads, trace ids) is not sensitive, so it is not masked. The panel reports unavailable with a reason when no configurable transaction manager exists. Capture, the initial recording state, buffer size, and thresholds are configurable under bootui.transactions.*, and the panel refreshes over Server-Sent Events from /bootui/api/transactions/stream.
This panel is not applicable on Quarkus: Narayana's JTA exposes no comparable per-boundary listener hook, so the endpoint reports unavailable with that reason rather than forcing false parity.
How capture works and what each transaction records
On Spring MVC and WebFlux, BootUI contributes a TransactionExecutionListener (Spring Framework 6.1+) through Spring Boot's transaction-manager customization. It composes with your own listeners; managers that do not implement the configurable listener SPI stay unobserved. On WebFlux this covers blocking managers used on a Reactor boundedElastic worker and a ReactiveTransactionManager such as R2DBC's, recorded without a thread-bound parent or isolation (WebFlux support). SQL and connection counts describe JDBC work on the begin thread, so zero counts do not prove that no database work occurred.
Each transaction records the boundary name (typically ClassName.methodName), a best-effort propagation (NEW or PARTICIPATING), the isolation level, the outcome (COMMITTED, ROLLED_BACK, or UNKNOWN), timestamps and duration, the enclosing transaction id, the thread, and the trace id. Each entry is correlated by thread and time window to SQL Trace executions, showing how many statements and connections it touched.
When the opt-in MCP Server is enabled on Spring MVC or WebFlux, get_transactions exposes the same bounded report.
Hibernate Statistics
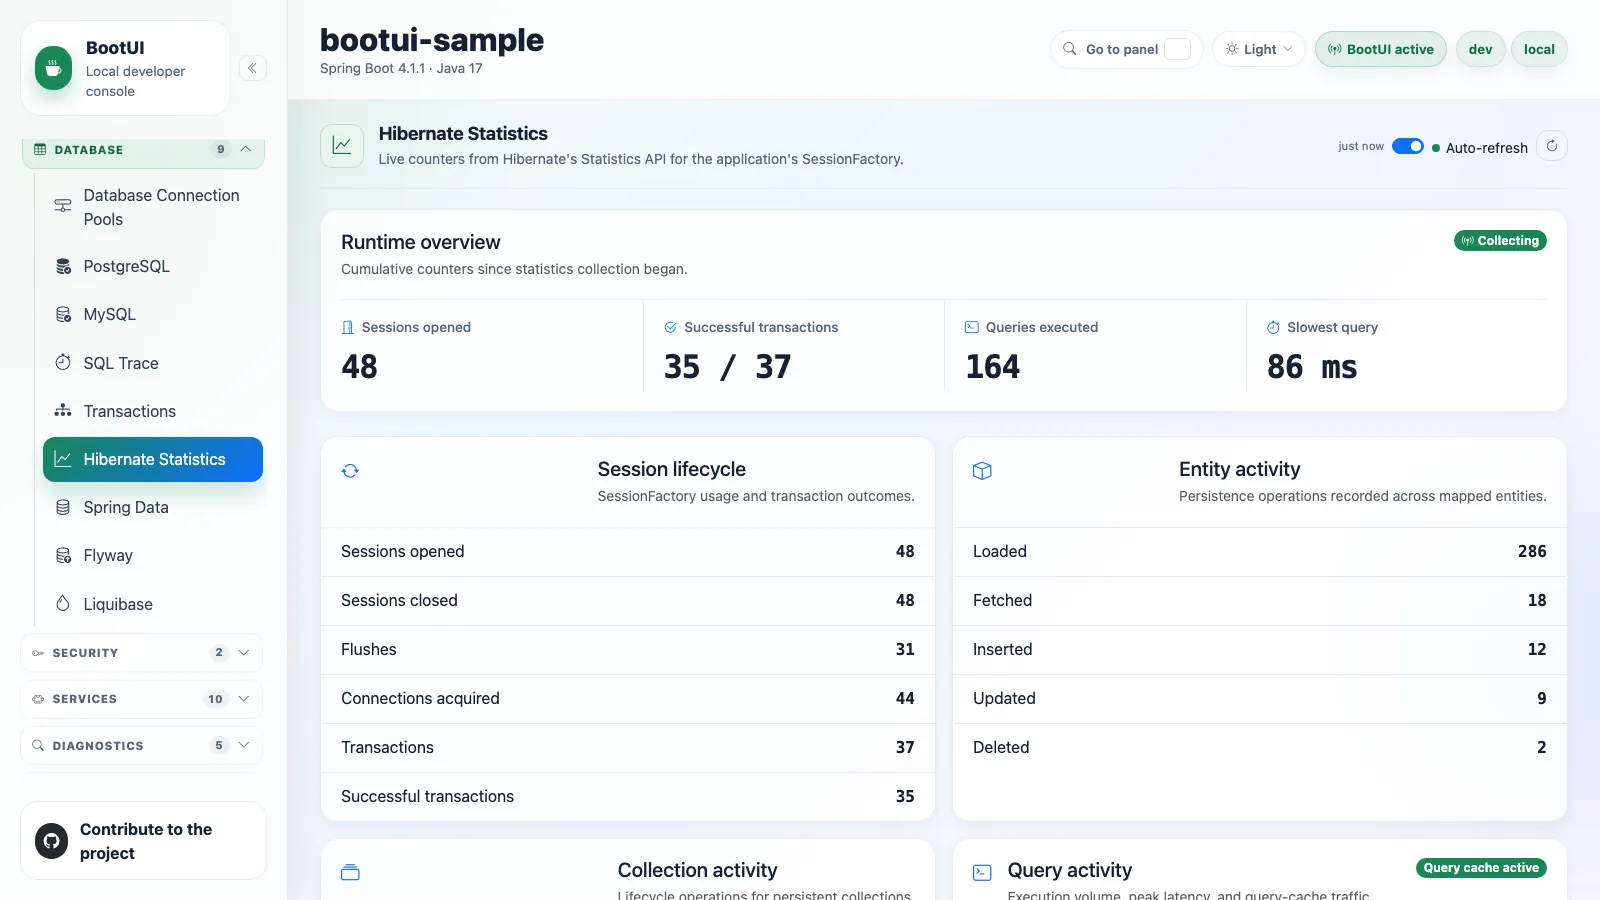
The Hibernate Statistics panel is a live, read-only view of Hibernate's own org.hibernate.stat.Statistics for the application's SessionFactory. It is a runtime monitor, separate from the Hibernate advisor's static checks.
The snapshot covers session and transaction counts, entity and collection load, fetch, insert, update, delete counts, query execution counts with the slowest query, and, when enabled, query-cache and second-level-cache hit, miss, and put counters with per-region breakdowns.
When statistics collection is off, the panel offers Enable for this runtime, which calls Statistics#setStatisticsEnabled(true) without rewriting your configuration. The persistent alternatives are hibernate.generate_statistics=true and quarkus.hibernate-orm.statistics=true (the HIB-CONFIG-007 recommendation of the Hibernate advisor). That toggle is the only mutation and follows the localhost, cross-site-write, and read-only policy; there is no reset action. The panel is identical on Quarkus.
Known limitations
Only the first resolved EntityManagerFactory is inspected, so a multi-persistence-unit application sees one unit. There is no per-entity or per-query drill-down beyond what Statistics exposes. bootui.monitoring.exclude-self does not apply, because these are process-global counters.
Spring Data
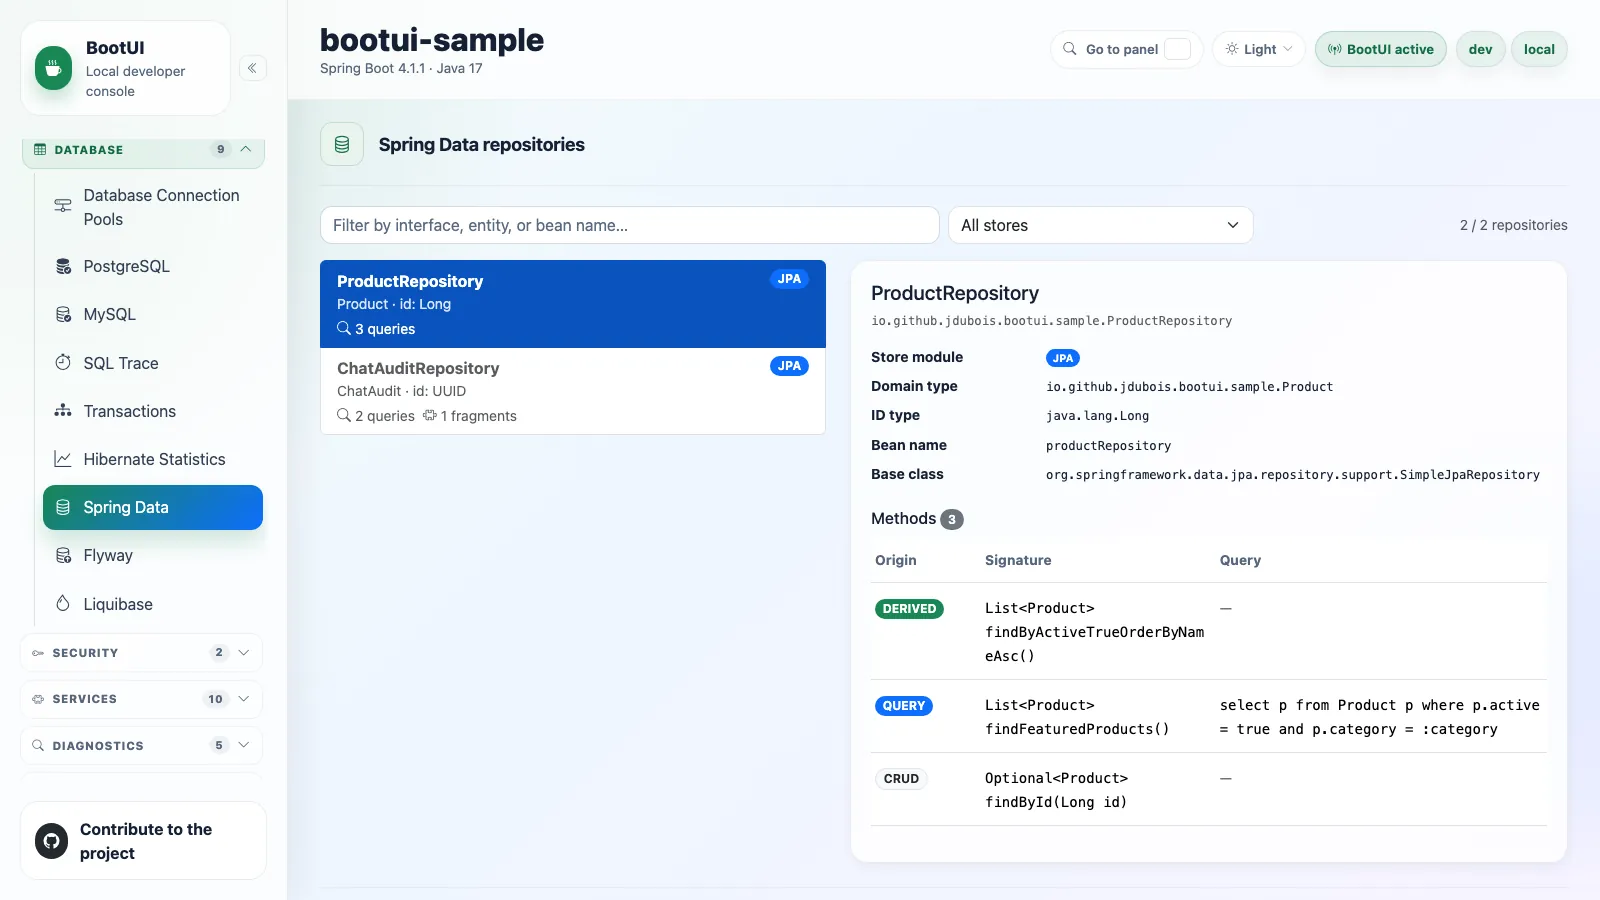
The Spring Data panel lists the application's Spring Data repositories with their interfaces, domain types, ID types, and query methods. It shows an empty state when Spring Data is absent or no repositories are registered.
Flyway
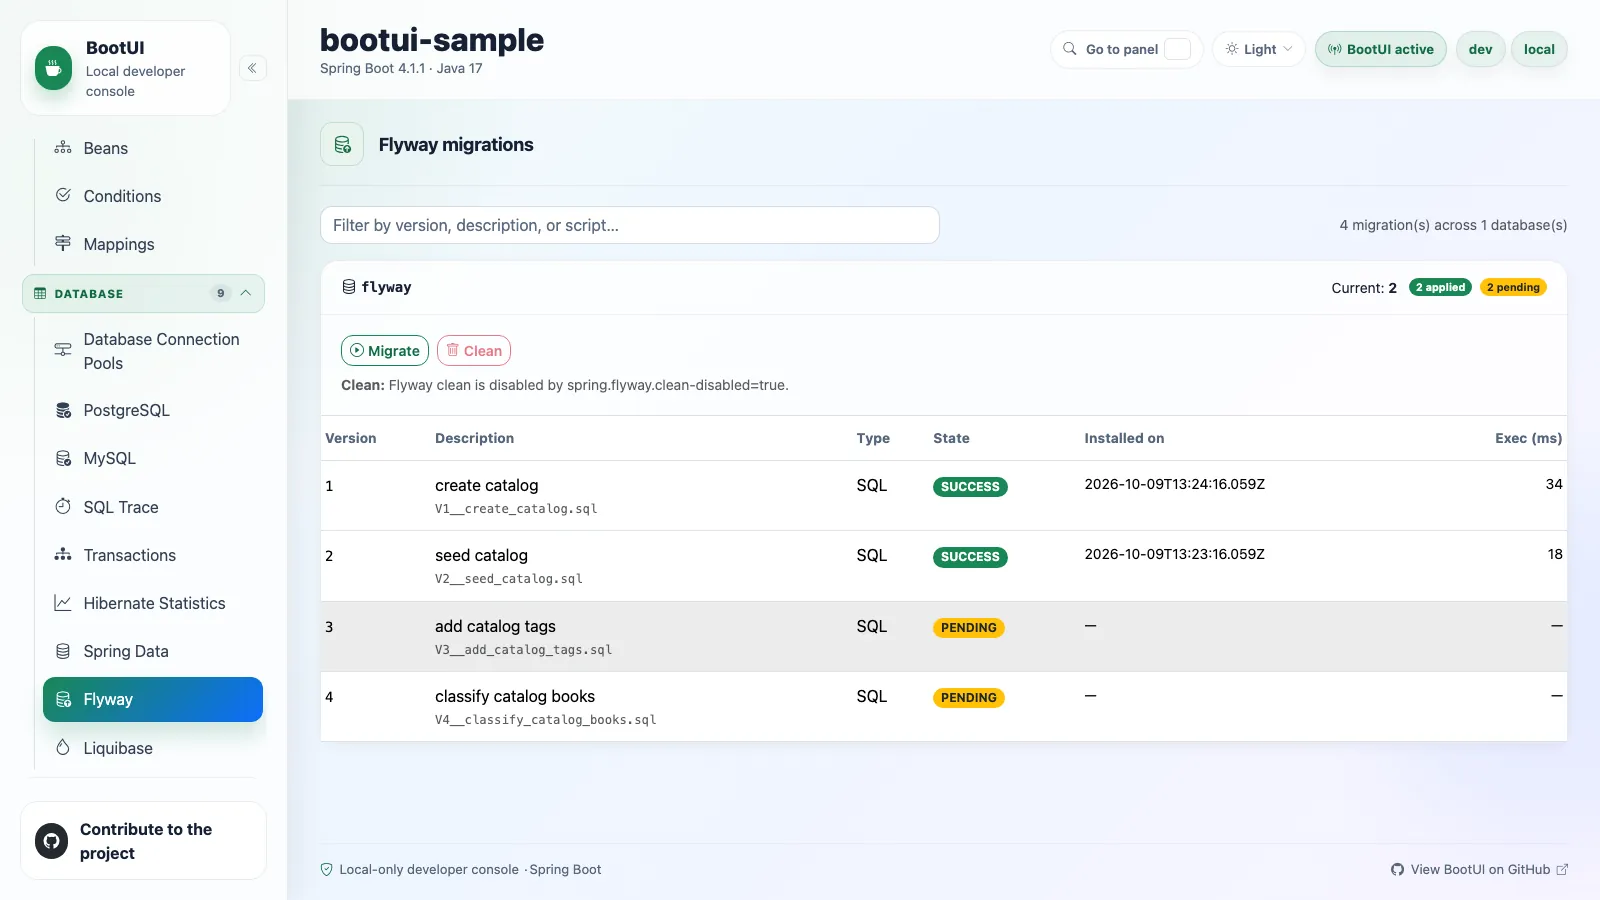
The Flyway panel shows the schema migrations of each Flyway bean: per database, the current schema version with the applied and pending migrations (version, description, type, script, state, installed-by, installed-on, execution time, checksum). Multiple and named datasources appear independently.
migrate and clean are confirmation-gated actions for trusted local sessions, blocked by bootui.read-only=true or bootui.panels.flyway.read-only=true. clean additionally requires spring.flyway.clean-disabled=false.
Quarkus reads the active FlywayContainer beans (default or @FlywayDataSource-named) and offers the same actions, with clean honoring quarkus.flyway.clean-disabled. Without the quarkus-flyway extension, the panel says to add it.
Spring Modulith module-aware migrations
When module-aware Flyway migrations are active, the panel shows the root and module-specific history tables separately. Those entries are read-only in BootUI. This is Spring-specific and not reported on Quarkus.
Liquibase
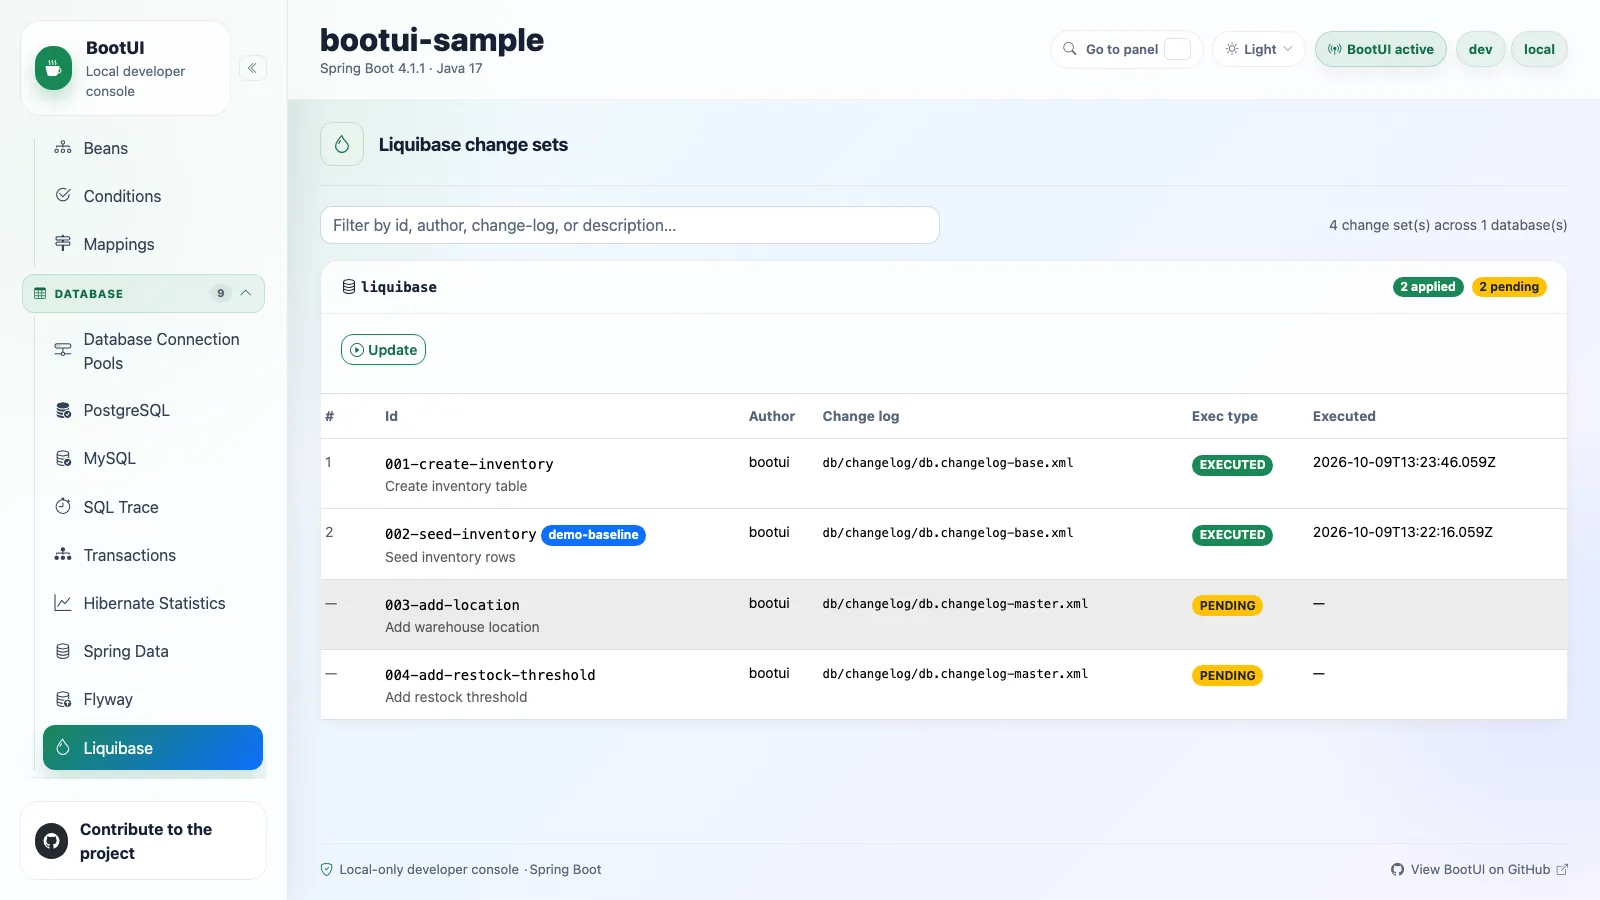
The Liquibase panel shows the change sets of each discovered Liquibase database: every SpringLiquibase bean on Spring Boot, and every active LiquibaseFactory on Quarkus, including @LiquibaseDataSource-named datasources.
It lists the applied and pending change sets per database with their id, author, change-log, description, execution type, date and order executed, checksum, tag, deployment id, contexts, and labels.
update is a confirmation-gated action that applies pending change sets, blocked by bootui.read-only=true or bootui.panels.liquibase.read-only=true on both frameworks. The panel fails closed per database when its history cannot be read, and shows an empty state when Liquibase is absent.