Developer tools
MCP Server
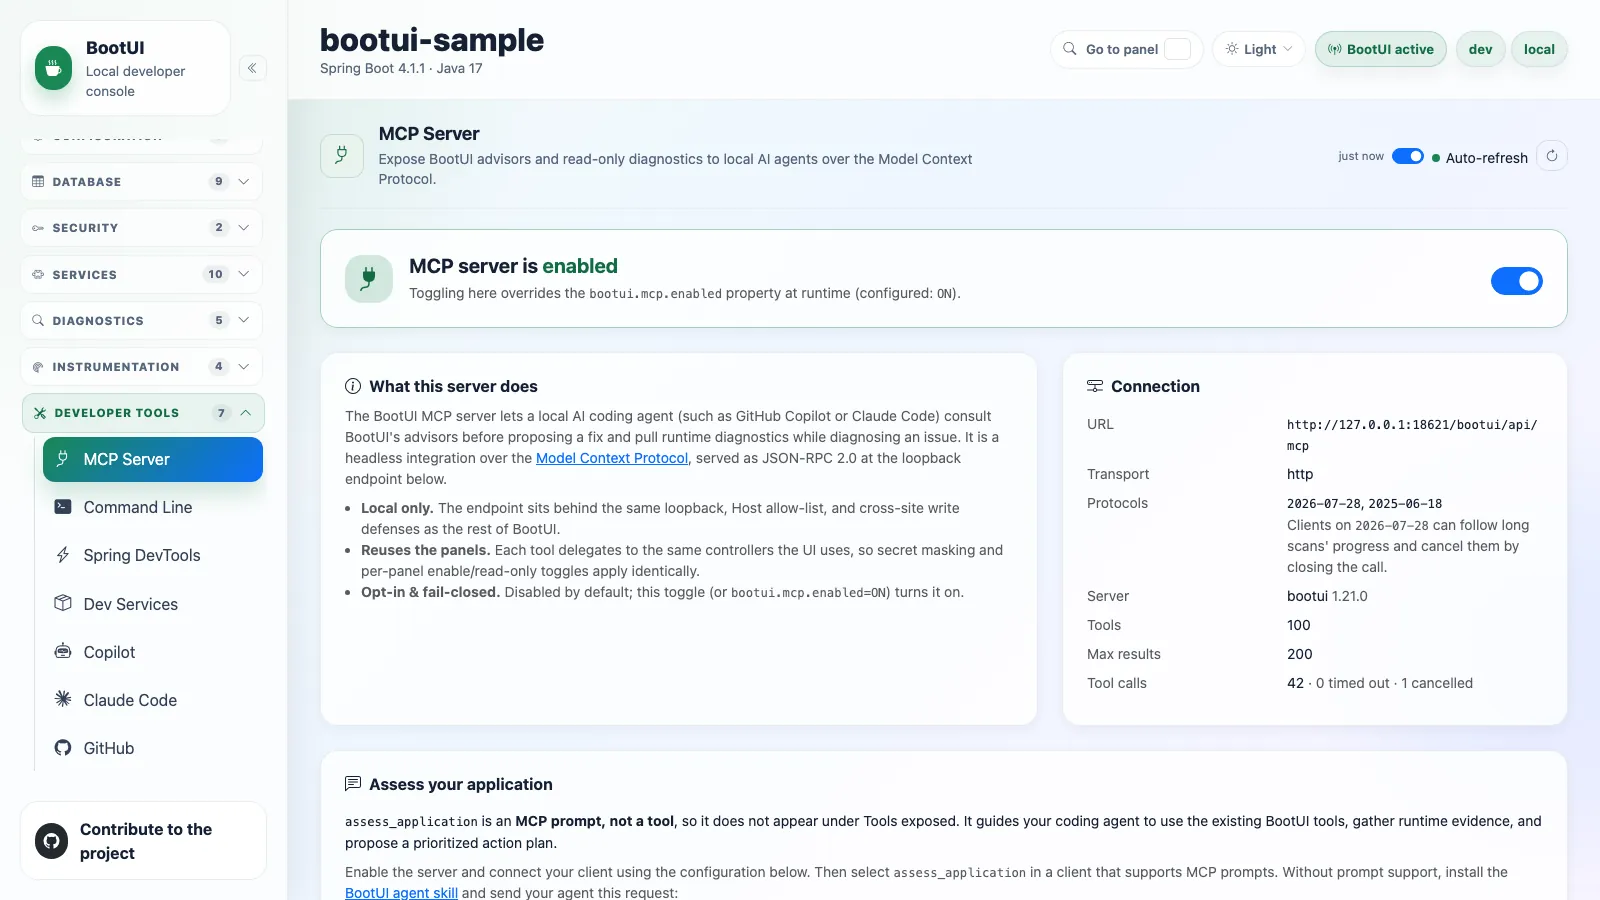
BootUI can expose its advisors and read-only diagnostics to local AI coding agents, such as GitHub Copilot or Claude Code, through an opt-in Model Context Protocol server. An agent can then consult the advisors before proposing a fix, and pull runtime diagnostics while investigating an issue.
The server is a JSON-RPC 2.0 endpoint at POST /bootui/api/mcp. Status and the advertised tool list are available from GET /bootui/api/mcp-server. It is disabled by default and, like the rest of the BootUI API, is reachable only over loopback unless non-loopback access is explicitly enabled, which requires authentication.
Enable it with bootui.mcp.enabled=ON, or use the toggle at the top of the panel. The toggle overrides the configured property for the lifetime of the running application, and the panel shows when the live state is an override.
Connecting a client
Point your client at the loopback HTTP endpoint of the running application:
{
  "servers": {
    "bootui": {
      "type": "http",
      "url": "http://127.0.0.1:8080/bootui/api/mcp"
    }
  }
}
The panel shows the transport, the protocol revisions served (MCP 2026-07-28 and 2025-06-18), the bootui.mcp.max-results cap, call counters, and a ready-to-use configuration for this running application, with one tab per client: VS Code (a servers block in .vscode/mcp.json), Claude Code (a claude mcp add --transport http command), Cursor (an mcpServers entry keyed on url in ~/.cursor/mcp.json), and Other clients. Claude Code users can skip this with the BootUI plugin.
A loopback agent needs no credentials, and neither do sources trusted through bootui.trusted-proxies or bootui.trust-container-gateway. When bootui.allow-non-localhost=true permits an otherwise untrusted source, every MCP call answers 401 until it sends BootUI's token in the Authorization header. Tick Agent connects from another host or container to add that header to every snippet. The panel never prints the token: it is the value of bootui.authentication.token, and when that is blank BootUI generates one at each start and logs it once.
Available tools
Tools reuse the existing services and captured evidence, with the same masking and panel policy as the REST API. Many reads are intentionally compact; see compact answers. Tools whose backing panel is absent are not advertised, so the live panel is the authoritative catalog for your stack.
- Advisor scans, cached reports, and per-rule violations for each advisor, such as
architecture_scan,get_architecture_report, andget_architecture_rule_violations.vulnerabilities_scanalso calls OSV.dev. - Runtime Insights reads:
get_runtime_insights,get_runtime_insight,get_runtime_impact, andget_runtime_run_comparison. See Runtime Insights. - Diagnostics reads:
get_live_activity,get_request_profile,get_exceptions,get_exception_detail,get_security_logs,get_sql_traces,get_traces,get_log_tail,get_http_exchanges,get_http_routes, andget_rest_client_traces. - Runtime and integration reads for most other panels, such as
get_overview,get_health,get_config,get_beans,get_metrics,get_threads, andget_github_dashboard. - Java agent reads:
get_code_inventory,get_code_paths,get_side_effects,get_agent_status, andget_method_probe. - Bounded controls: clearing, pausing, and resuming captures, read-only database reads, heap dump analysis, and
trigger_devtools_livereload.
Destructive, database-mutating, arbitrary-command, heap-capture and download, HTTP-probe, GitHub-write, and dev-service-restart operations are not exposed.
Clients with prompt support can also select diagnose_runtime_issue, verify_after_change, review_application, or assess_application. These are instructions for the external agent, not new scan tools. See assess an application and approve an action plan.
Full tool catalog
Advisor scans — architecture_scan, spring_scan, hibernate_scan, database_advisor_scan, memory_scan, security_scan, pentest_scan, rest_api_scan, graalvm_scan, crac_scan, and vulnerabilities_scan, each with cached get_<name>_report and, for most, get_<name>_rule_violations. On Quarkus, the spring tools run the Quarkus application advisor.
Diagnostics reads — get_transactions is Spring MVC and WebFlux only. get_live_activity returns the correlated feed described in Live Activity, grouped by request or execution id. get_request_profile takes a profileable request or execution id and returns available, unavailableReason, source, journal, and buffers; when an HTTP exchange is also retained, buffers carries the richer per-request profile. An unknown, cleared, or expired id returns an explicit tool error. get_exception_detail returns a group's stack trace, causes, and occurrences.
Runtime and integration reads are named get_<panel>, such as get_overview, get_health, get_config, get_beans, get_mappings, get_loggers, get_metrics, get_threads, get_flyway_migrations, get_emails, get_kafka_activity, get_websockets, and get_github_dashboard. The other read tools are get_ai_overview, get_cache_stats, get_claude_code_sessions, get_conditions, get_copilot_sessions, get_crac_report, get_database_advisor_report, get_database_connection_pools, get_dev_services, get_devtools_status, get_fault_tolerance, get_graalvm_report, get_heap_dump_report, get_hibernate_report, get_hibernate_statistics, get_http_sessions, get_jms_activity, get_jvm_tuning, get_liquibase_changesets, get_live_memory, get_memory_report, get_mysql_report, get_pentest_report, get_postgresql_report, get_profile_diff, get_rabbitmq_activity, get_rest_api_report, get_scheduled_tasks, get_security_report, get_spring_data_repositories, get_spring_report, get_spring_rule_violations, get_spring_security, get_startup_timeline, and get_vulnerabilities_report.
Recording controls — clear_exceptions, clear_rest_client_traces, clear_sql_traces, clear_traces, clear_transactions, pause_rest_client_recording, pause_sql_trace_recording, pause_transaction_recording, resume_rest_client_recording, resume_sql_trace_recording, and resume_transaction_recording.
Java agent — get_code_inventory, get_code_paths, and get_side_effects (see Code Inventory, Code Paths, and Side Effects). start_method_probe records one application method's next 20 invocations for at most 60 seconds, metadata only; it needs the user's separate approval and read-only policy refuses it, and get_method_probe reads the result (see Method probes). enable_agent_sensor and disable_agent_sensor apply the panel's bounded runtime switches, require an attached, armed agent, and follow the Java Agent panel's read-only policy. Read get_agent_status first, ask for the user's approval, and read it again afterwards (see Runtime switches).
Bounded controls — clear_*, pause_*_recording, and resume_*_recording for exceptions, SQL traces, transactions, traces, and REST client traces, plus postgresql_read, mysql_read, analyze_heap_dump, and trigger_devtools_livereload.
Safety model
The server inherits BootUI's full safety model:
- It is live only while BootUI itself is active. On Quarkus it is absent from a production build, with no flag that turns it on. On Spring the
prodandproductionprofiles disable BootUI, and only an explicitbootui.enabled=ONoverrides that. - The endpoint sits behind
LocalhostOnlyFilter, with its loopback source check,Hostallow-list, and cross-site write protection. It is exempt from the SPA CSRF token, which only browsers can present, so non-browser clients connect from loopback or trusted sources without credentials while the cross-site defenses still block browser-driven writes. Other permitted non-loopback clients must send the BootUI bearer token. - Read tools require their backing panel to be enabled. Action tools are also refused when the panel is read-only or
bootui.read-only=true, with a clear tool error. - Values pass through the same secret masking and
bootui.expose-valuesmode as the REST API, and paginated reads are capped bybootui.mcp.max-results. - Request bytes, concurrent calls, tool execution time, and rendered response bytes have configurable hard limits. Refusals use bounded JSON-RPC errors, or a bodyless HTTP
413when even that cannot fit. The status endpoint exposes call count, aggregate latency, and each refusal count. - Unexpected server failures return only JSON-RPC
-32603withInternal error; exception messages, stack traces, paths, queries, and credentials are never included, and the original throwable is logged once on the server. A tool that refuses a request because of the request itself, such as an unknown id, reportsisError: truewith the same reason the REST API returns.
Differences on Quarkus and WebFlux
The protocol core lives in the shared engine, so requests and responses are byte-identical across backends.
Quarkus runs the same endpoint and runtime toggle, reading bootui.mcp.* from MicroProfile Config. Its catalog declares 89 tools against Spring MVC's 105, before runtime capability filtering, and withholds tools behind Spring-only panels: the GraalVM and CRaC scans and reports, Conditions, Startup Timeline, HTTP Sessions, Spring Data, Spring Security, JMS, DevTools, and every transaction tool. spring_scan runs the Quarkus-native idiom advisor.
Spring Boot WebFlux uses a reactive tool catalog that binds the WebFlux Live Activity, Exceptions, Security Logs, SQL Trace, and Log Tail controllers and reuses the shared controllers elsewhere.
See the bootui.mcp.* settings and AI agents for an end-to-end workflow and how BootUI pairs with Coffilot.
Command Line
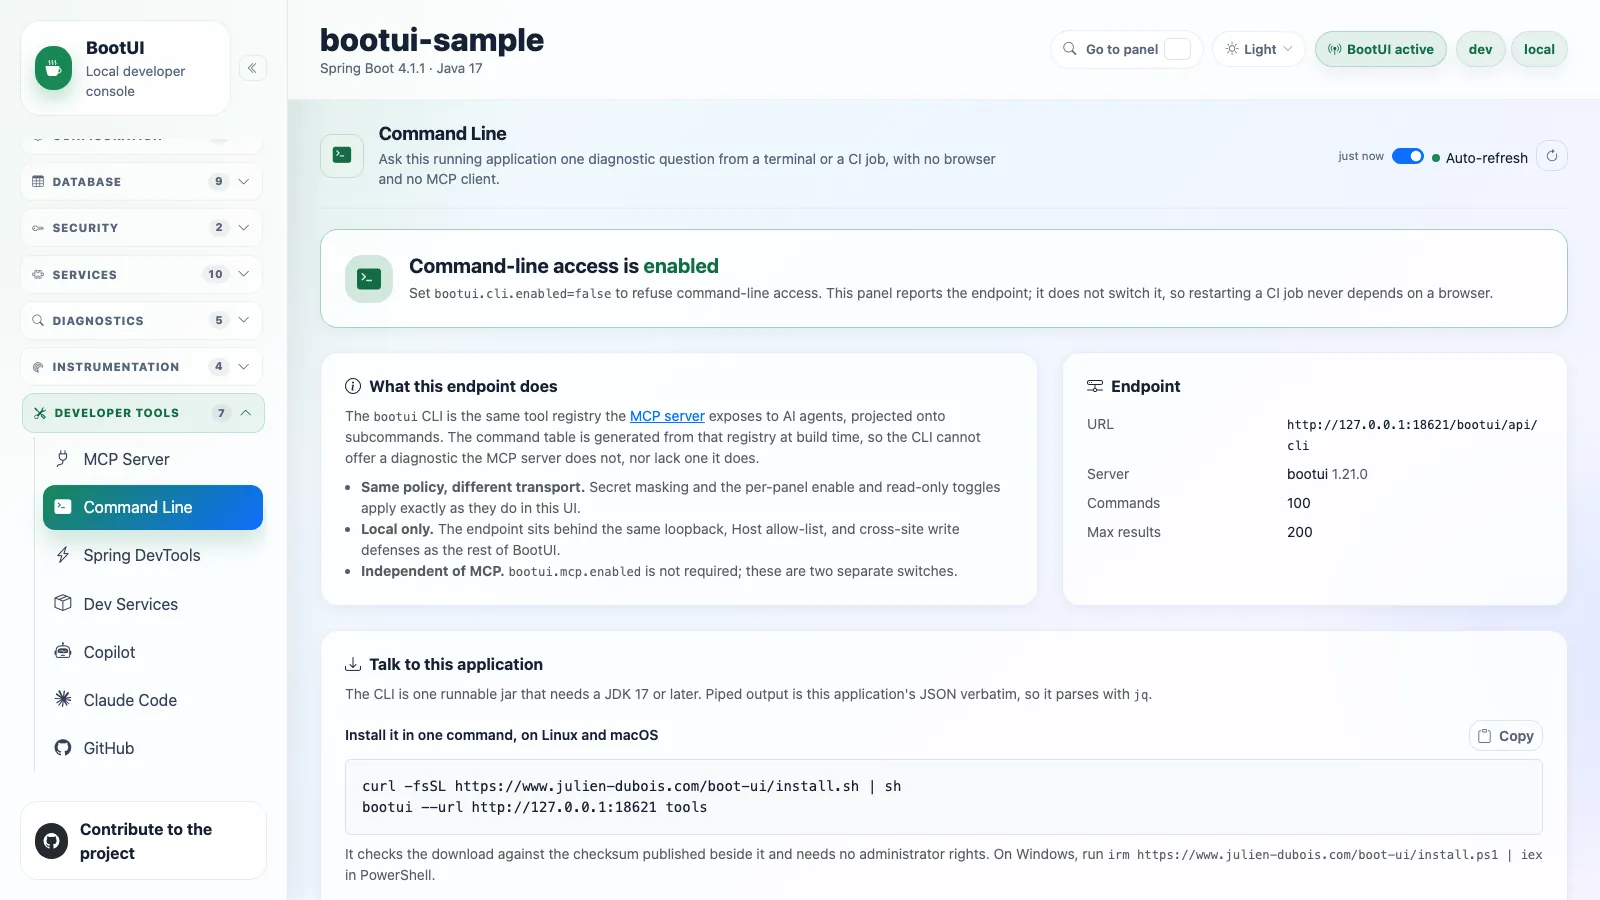
The Command Line panel reports the /bootui/api/cli endpoint that backs the bootui CLI. The CLI projects the same tool registry the MCP server exposes onto terminal subcommands, so a developer or a CI job can ask one diagnostic question without an MCP client or a hand-written curl.
Unlike the MCP server, the endpoint is enabled by default, and the panel is read-only. Turn the endpoint off with bootui.cli.enabled=false; it then answers 503.
The panel shows this instance's endpoint URL, three ready-to-paste installs (the one-command installer, JBang, and a plain curl with java -jar versioned to match this application), and an example command pointed at it, including --api-path when bootui.api-path is customised.
It then lists every command this instance advertises, split into action and read commands. Each row shows the command to type, such as bootui architecture scan, its arguments, the MCP tool it maps to, its backing panel, and whether that panel is disabled or read-only. That last column explains an exit code of 2: BootUI declining to run a tool is a statement about how the target is configured, not a failed request.
Where the command list comes from
The spellings come from the running application through GET /bootui/api/cli, not from the CLI's own build, so the panel shows what this instance answers to even when the CLI on your path was built against another BootUI version. Call counters (calls, mean latency, capacity refusals, timeouts) are tracked separately from the MCP server's. There is no response-limit counter, because the command-line facade applies no response byte budget.
Spring DevTools
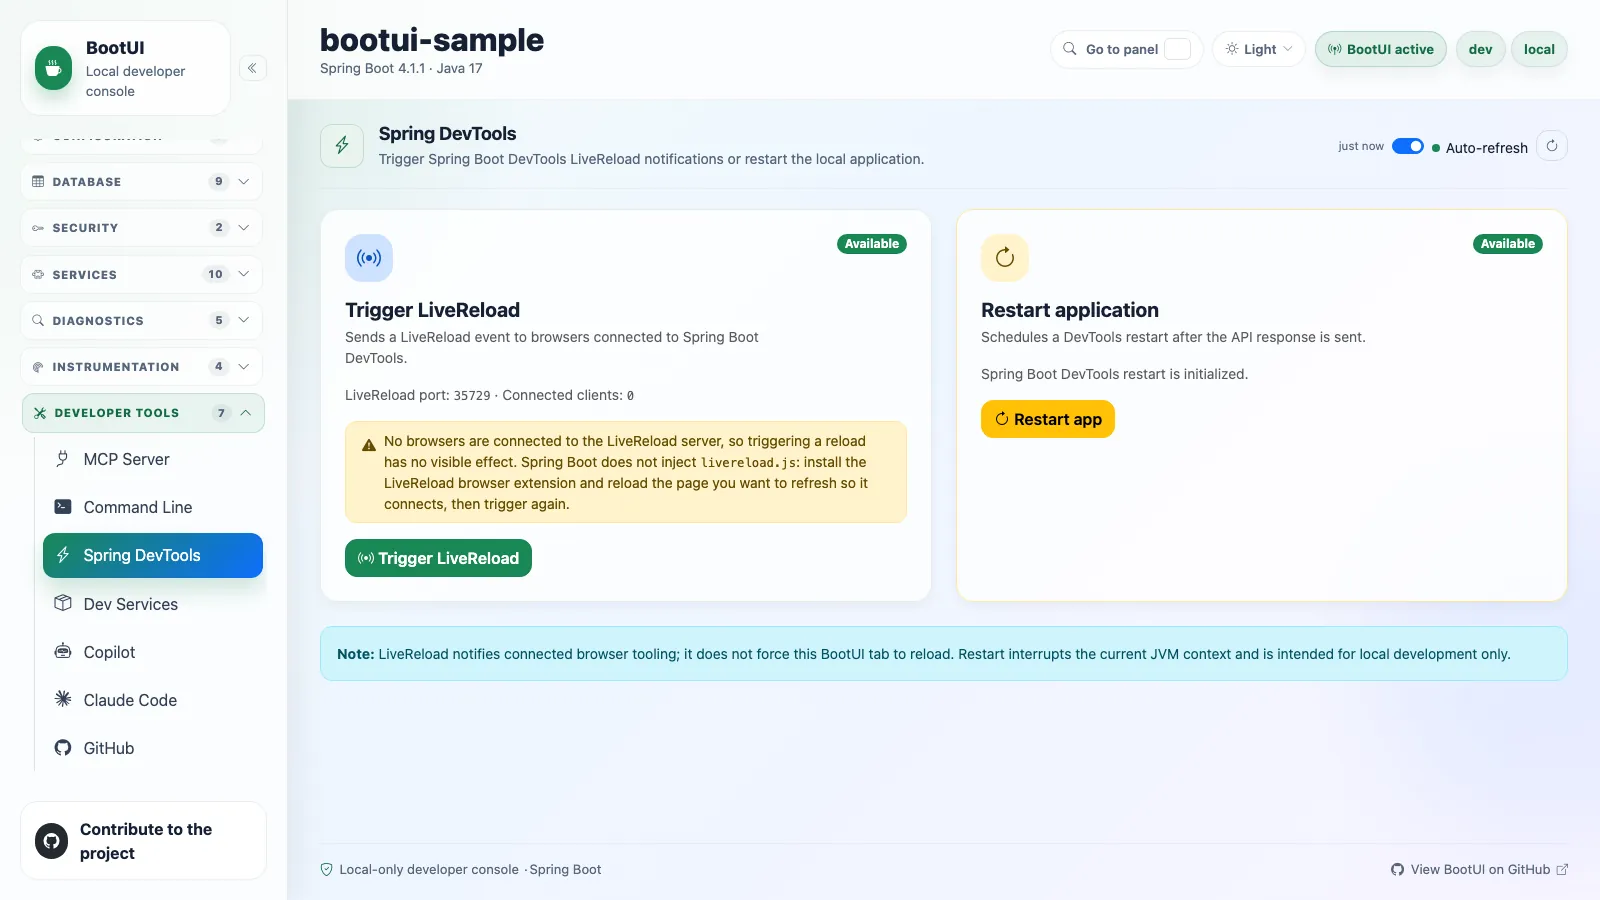
The Spring DevTools panel reports DevTools availability, LiveReload status, and restart support. Restart actions appear only when available and require confirmation. They require the documented JSON acknowledgement; an unrecognized reply reports an unknown outcome and re-reads status without retrying.
Spring Boot 4 disables LiveReload by default, so when DevTools is on the classpath and the LiveReload server is not running, the panel suggests spring.devtools.livereload.enabled=true.
The LiveReload card reports how many browsers are connected. Spring Boot does not inject livereload.js, so a browser needs the LiveReload extension to connect on port 35729. With no clients connected, triggering a reload returns a warning rather than a misleading success.
This panel is not applicable on Quarkus, which has its own dev-mode live reload.
Dev Services
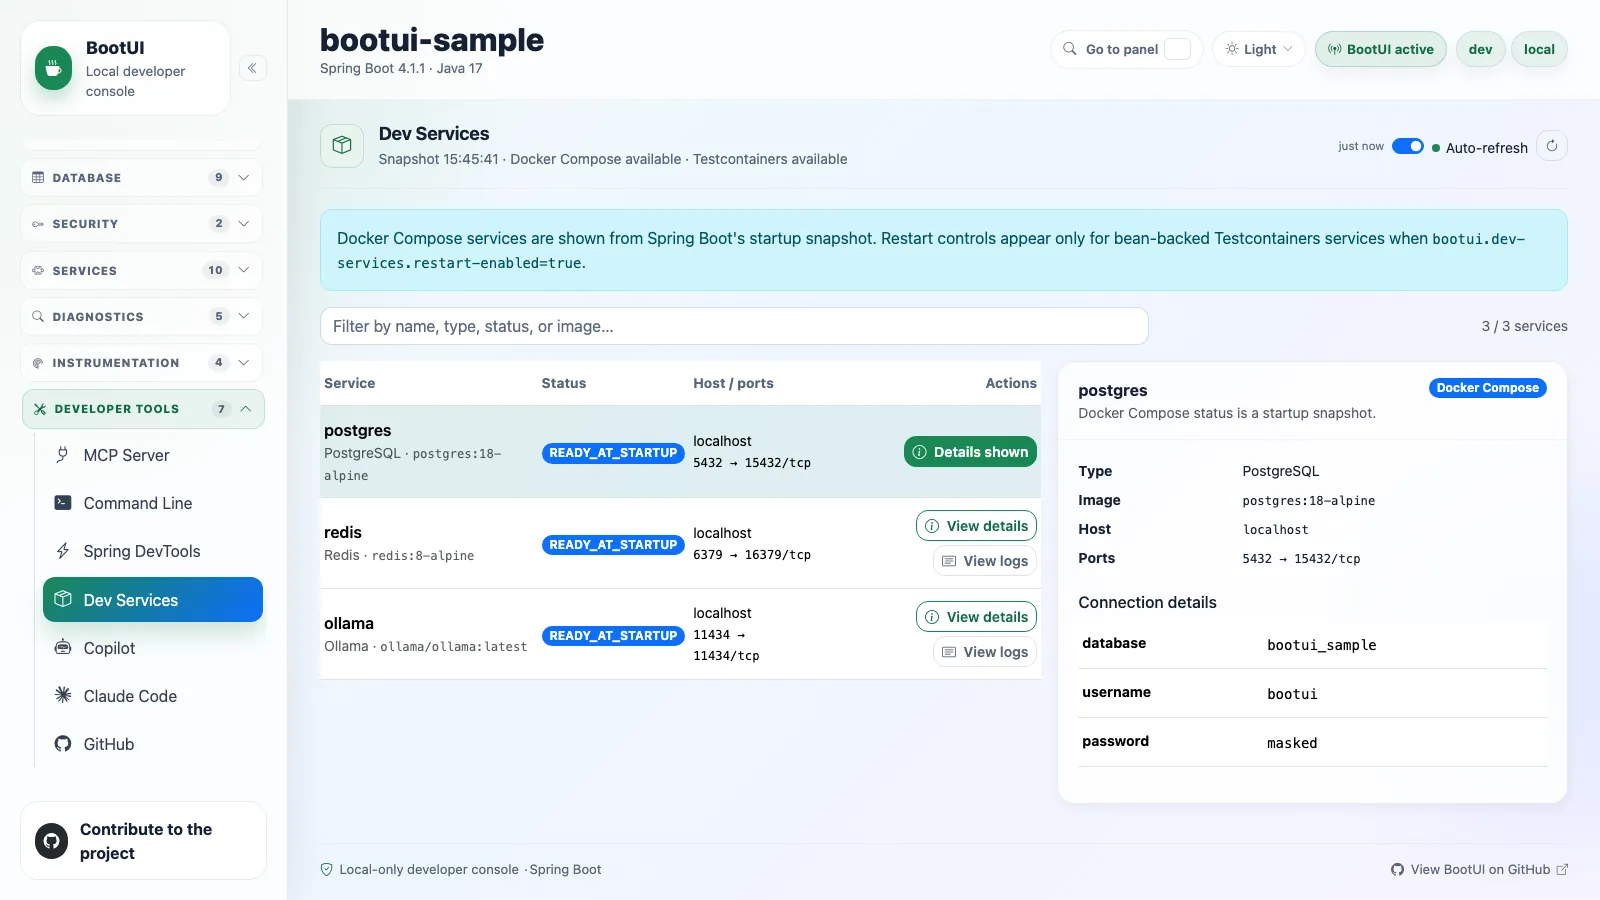
The Dev Services panel shows local development services discovered from Docker Compose snapshots, Testcontainers beans, and service connection metadata, and can show bounded logs for supported services. Restart controls appear only for supported Testcontainers services, and only when bootui.dev-services.restart-enabled=true.
Opening the panel is side-effect free: lazy, prototype, and otherwise uninitialized service beans are skipped and reported as warnings. Connection details, such as credentials in a JDBC URL, are masked before they reach the browser. Container logs, bounded by bootui.dev-services.log-tail-bytes, follow the Log Tail exposure rule: masked under the default bootui.expose-values=MASKED, not read under METADATA_ONLY, and verbatim only under FULL or bootui.mask-secrets=false.
Masking covers recognizable secrets, not every secret
Container logs are masked only where a secret has a recognizable shape: the first word of a secret-like key=value assignment, and the credential after an authorization scheme. A bare token, a short credential after a scheme with no key, or a credential inside a connection string still surfaces here.
On Quarkus the panel reports the framework's native Dev Services, captured from the build-time DevServicesResultBuildItem snapshot, with the service name, container id, and masked injected configuration. Quarkus manages live logs and restarts itself, so those controls are unavailable there.
Copilot
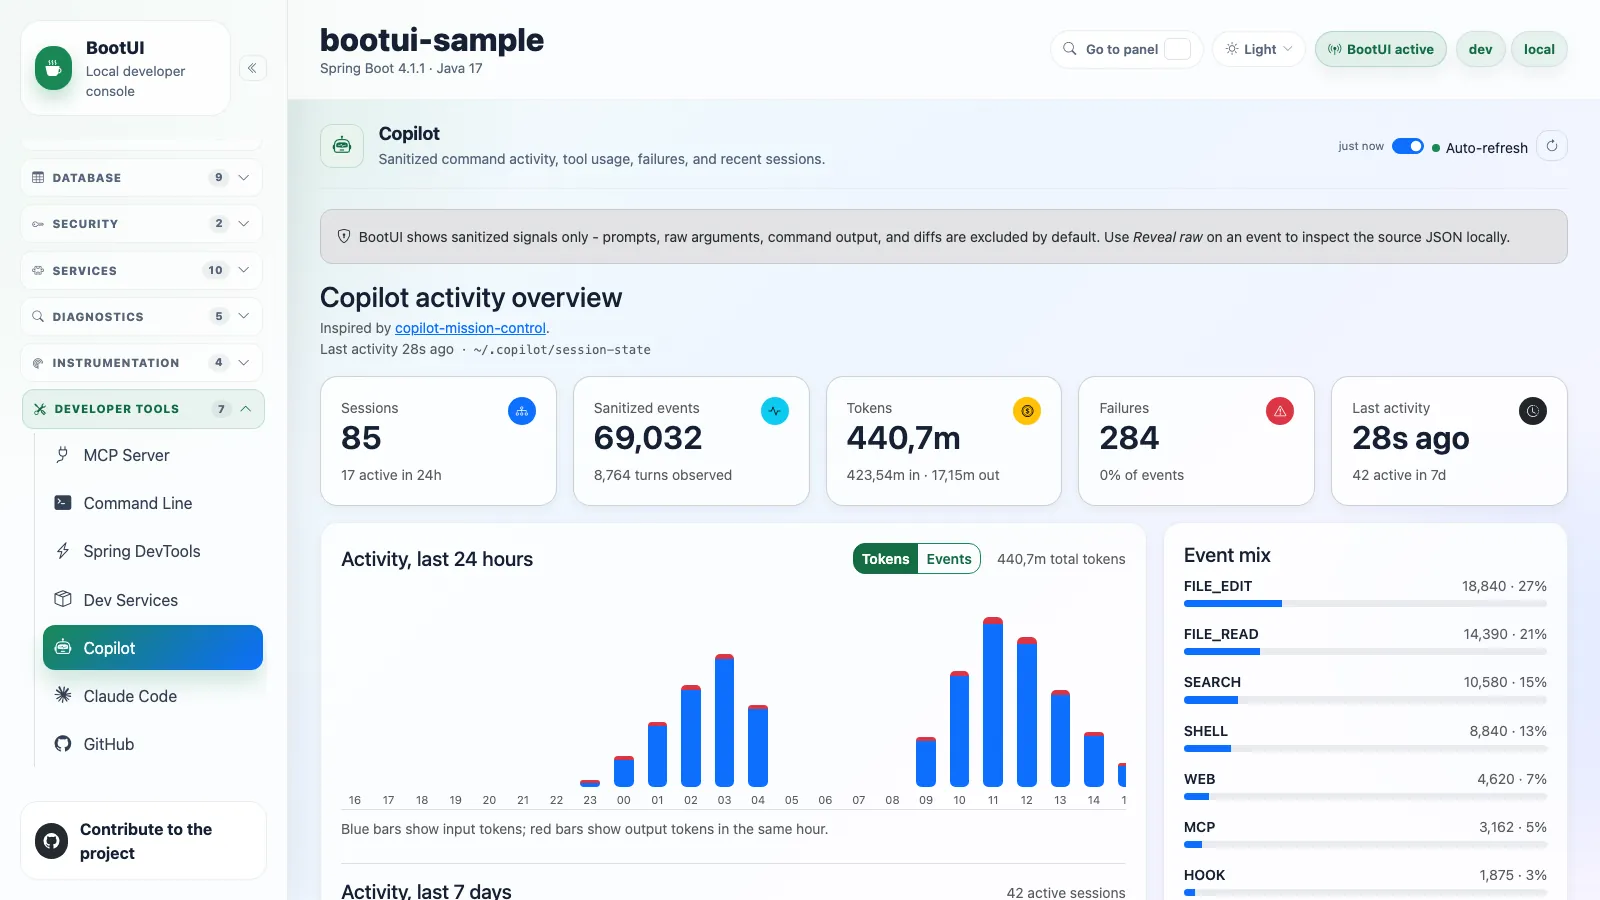
The Copilot panel shows sanitized signals from local GitHub Copilot CLI sessions. It reads the session directories and events.jsonl files under ~/.copilot/session-state/, which bootui.copilot.session-state-dir relocates, and aggregates active sessions, events, failures, 24-hour and 7-day activity, top tools, model usage, and recent sessions. Token usage appears when the local logs include it.
Each event row shows an allowlisted summary only. Raw prompts, tool arguments, command output, and diffs are excluded. The per-event Reveal raw action is a local-only escape hatch; disable it with bootui.copilot.allow-raw-reveal=false. It is also blocked under bootui.expose-values=METADATA_ONLY.
The sidebar dims the panel when no session-state directory is found. Data is read-only: BootUI never modifies anything under ~/.copilot/.
Explorer and limits
The session explorer drills into tool calls, edits, searches, shell commands, MCP tool calls, hooks, skills, and sub-agents. It returns the most recent bootui.copilot.max-sessions sessions, and bootui.copilot.max-parsed-sessions caps how many session files are parsed and retained in heap. The activity charts default to token usage and toggle back to events and failures; selecting an hour or day filters the explorer. Inspired by copilot-mission-control.
Claude Code
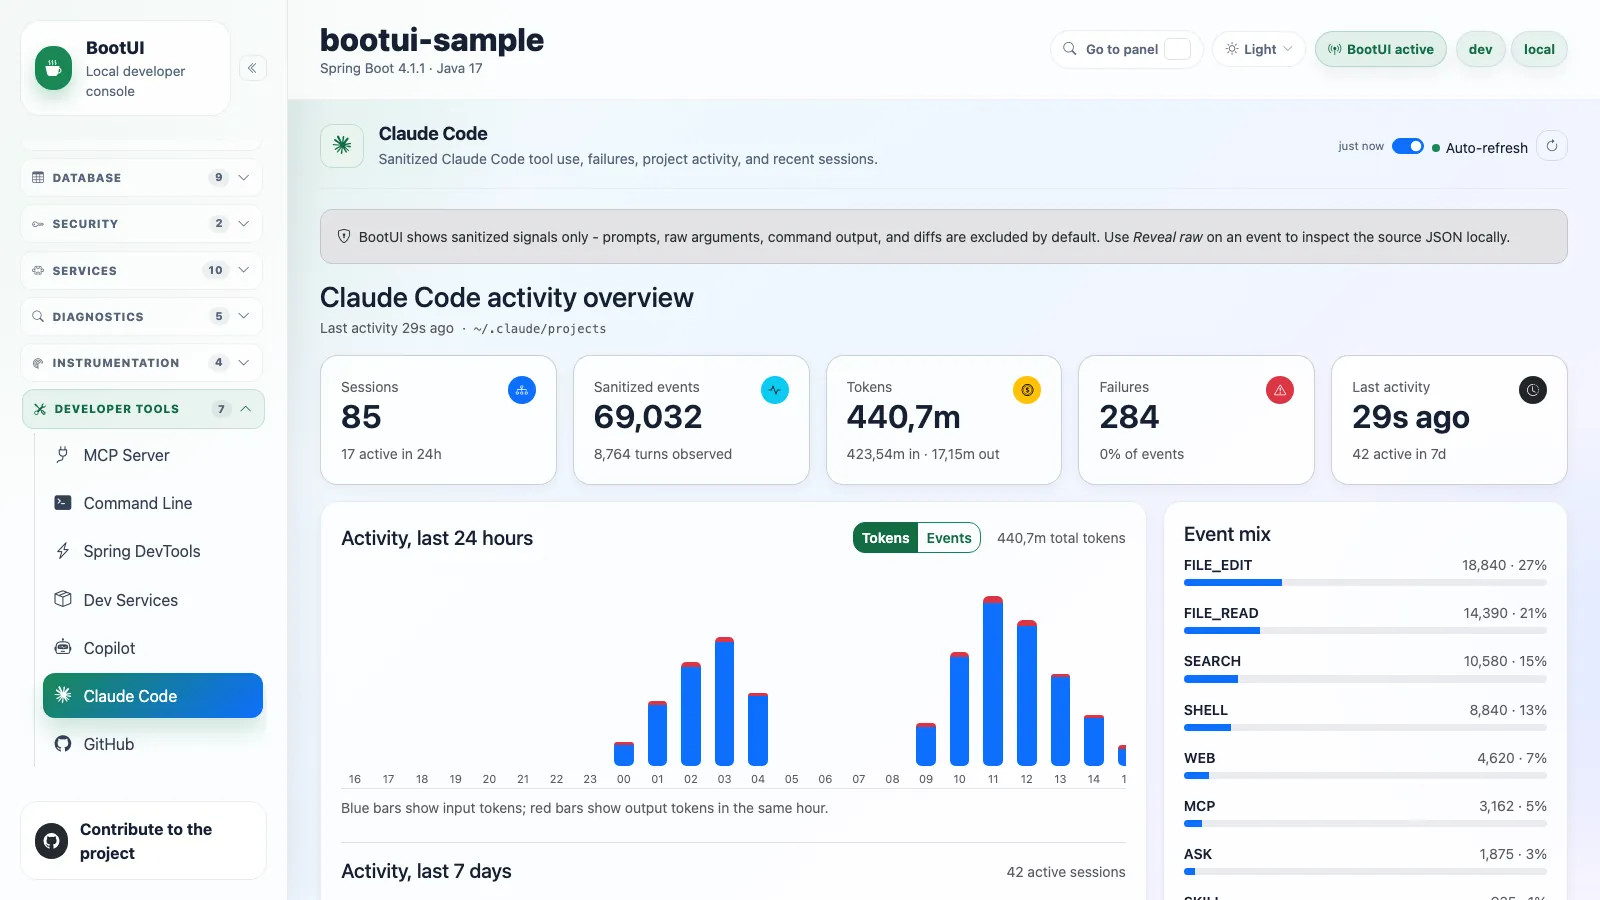
The Claude Code panel mirrors the Copilot dashboard for local Claude Code project logs. It reads the JSONL session files under ~/.claude/projects/, configurable with bootui.claude-code.session-state-dir, and shows sanitized activity trends, tool, model, and token usage, failures, recent sessions, and per-session drill-downs.
BootUI treats these logs as especially sensitive. Prompts, assistant text, tool inputs, file contents, command output, and tool results are excluded, and the raw JSONL reveal is disabled by default with bootui.claude-code.allow-raw-reveal=false. Enabling it is a local-only escape hatch, still blocked under bootui.expose-values=METADATA_ONLY.
bootui.claude-code.max-parsed-sessions caps how many JSONL files are parsed and retained in heap. The sidebar dims the panel when no projects directory is found. Data is read-only: BootUI never modifies anything under ~/.claude/.
GitHub
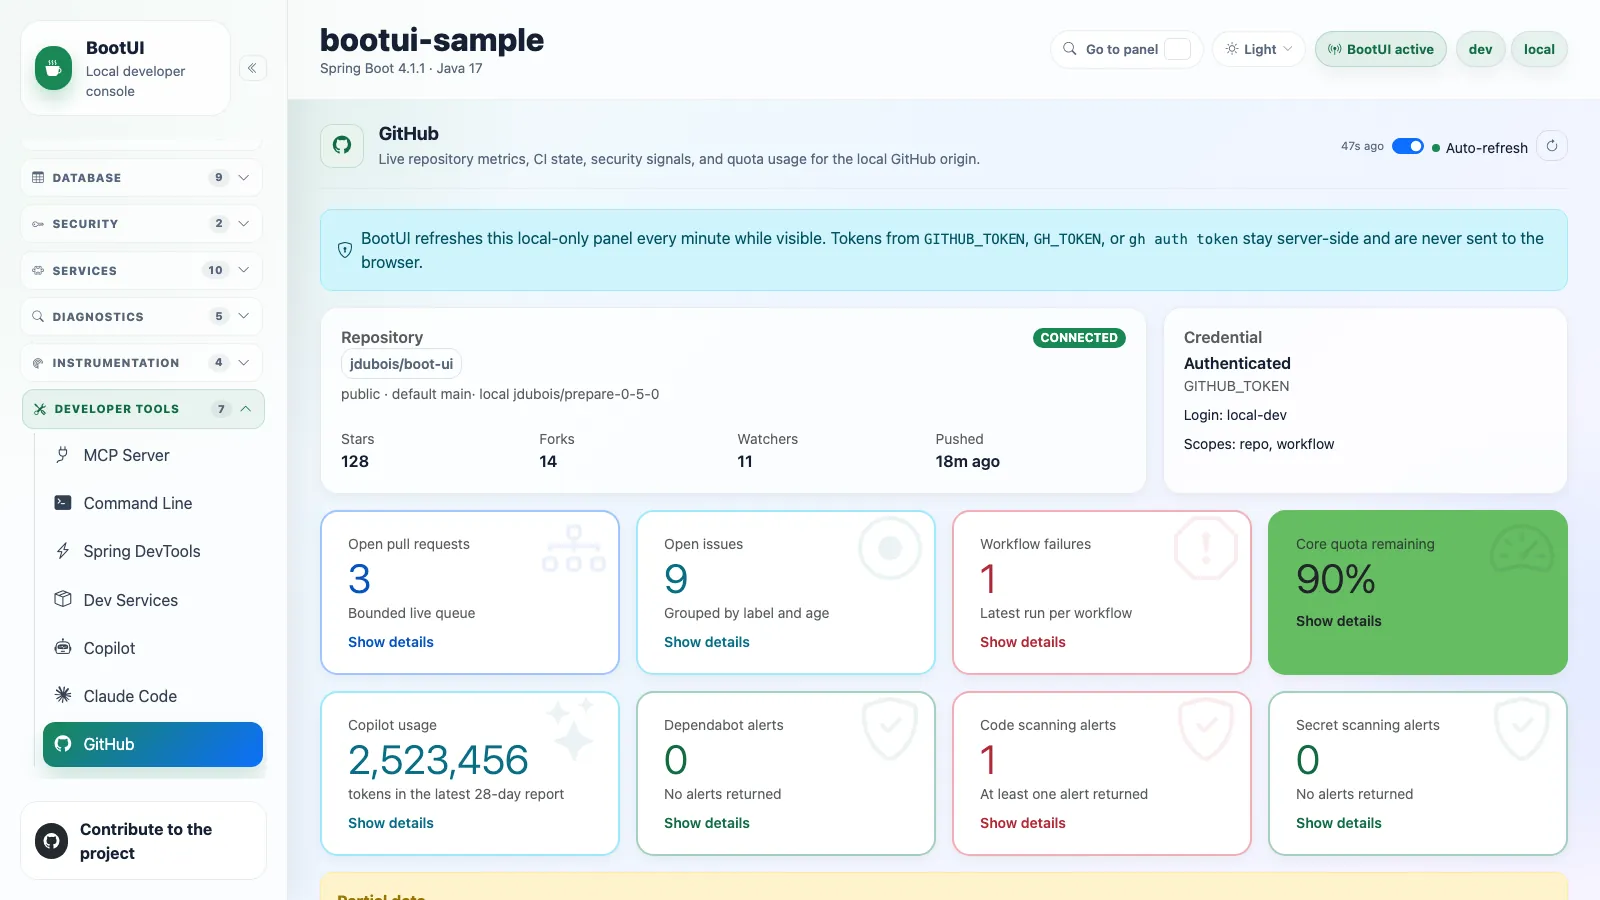
Summarizes the current project's GitHub state, read from the local origin remote. It auto-refreshes every minute while the tab is visible. GET /bootui/api/github never contacts GitHub; it returns the cached report. Only POST /bootui/api/github/refresh reaches the API, gated by bootui.github.api-enabled and the host allow-list. Opening the panel and each auto-refresh tick issue that refresh unless the panel is read-only, in which case the panel falls back to the cached GET.
The panel shows repository metadata and an eight-card summary grid, each card opening a detail drawer:
- Open pull requests and open issues, with labels, staleness buckets, author, comment count, and last update.
- GitHub Actions, with rows linking to the run. The failure count considers only the latest execution per workflow and branch.
- Quotas, showing the lowest remaining percentage, with every resource from
/rate_limitin the drawer. - Copilot usage, with the report window and link count only. Signed report URLs are never downloaded or exposed.
- Three security signals linking to the alert pages. Dependabot also lists open alerts, capped by
bootui.github.max-security-alerts. Code scanning and secret scanning stay count-only and never show secret values or code snippets.
Credentials are read from the current device only: GITHUB_TOKEN, GH_TOKEN, or an existing gh auth token login. The token is never sent to the browser, persisted by BootUI, or included in warnings. Without a token, public repositories use GitHub's unauthenticated rate limits.
Refresh bounds and Quarkus
Refreshes are bounded by per-request timeouts, a maximum API-call budget, and a quota safety threshold that skips optional sections before exhausting the core API quota. Best-effort cards for Actions cache, artifacts, and billing appear when the credential can reach those endpoints. The panel is identical on Quarkus, over the same /bootui/api/github contract.