Runtime
Health
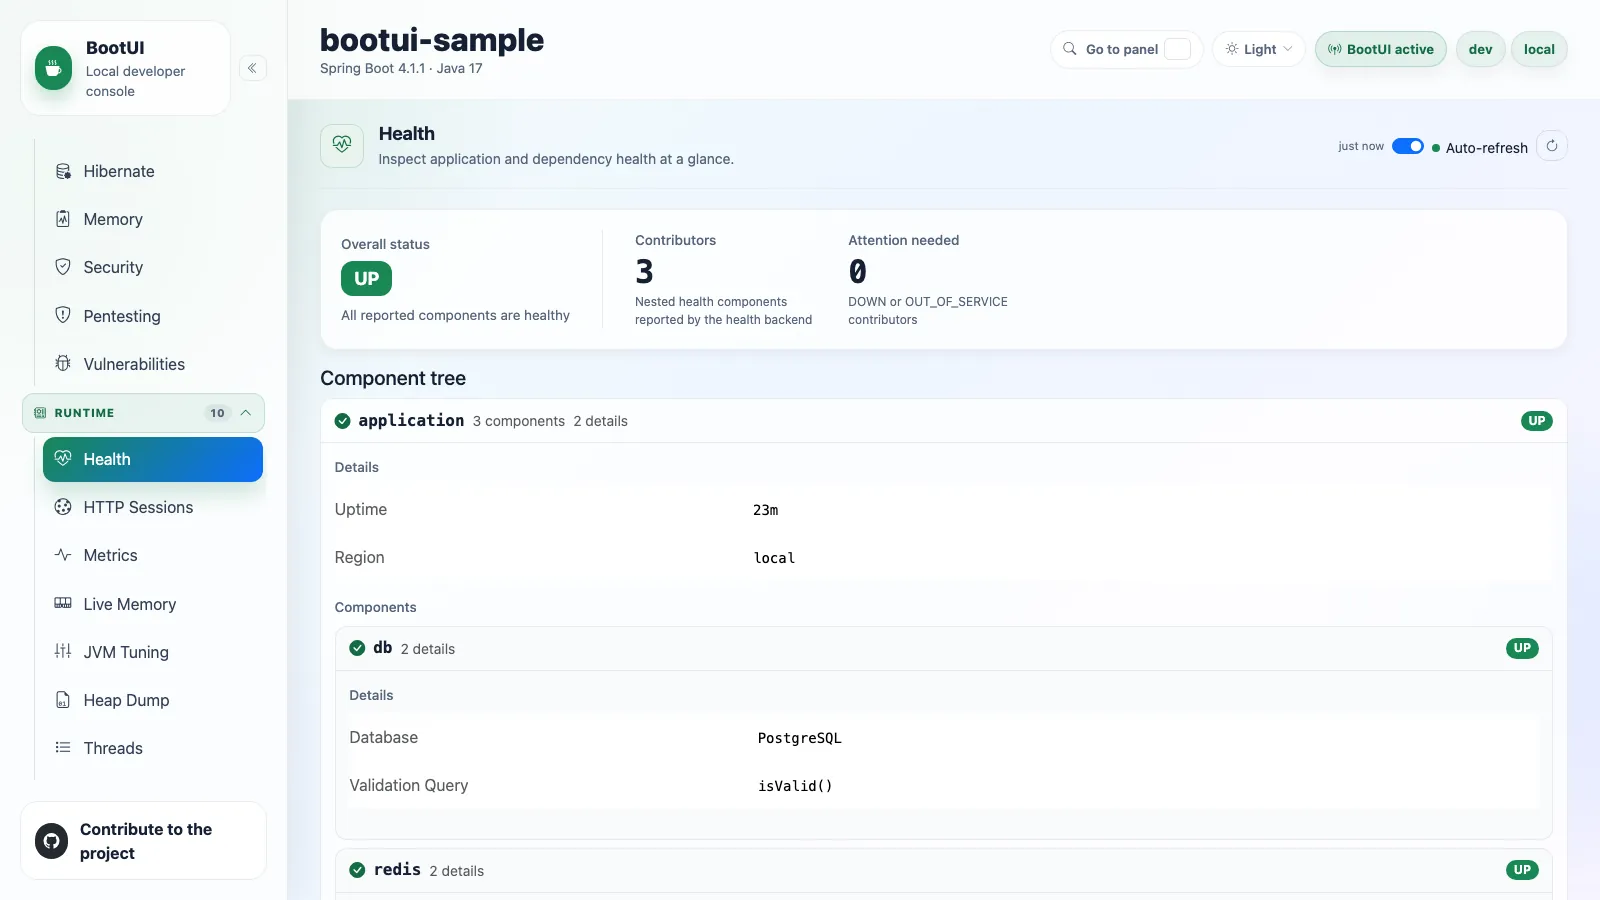
The Health panel displays the Actuator health tree, including nested contributors and detail when the application exposes it.
Unavailable health data is kept separate from unhealthy application state, so missing Actuator infrastructure is never presented as a healthy status: the panel shows setup guidance instead. When Actuator health reports only Spring Boot's default indicators, the panel keeps the live statuses visible and suggests adding application or dependency contributors.
On Quarkus the panel reads SmallRye Health in-process and maps the liveness and readiness report onto the same status tree. When quarkus-smallrye-health is absent, the panel shows setup guidance.
HTTP Sessions
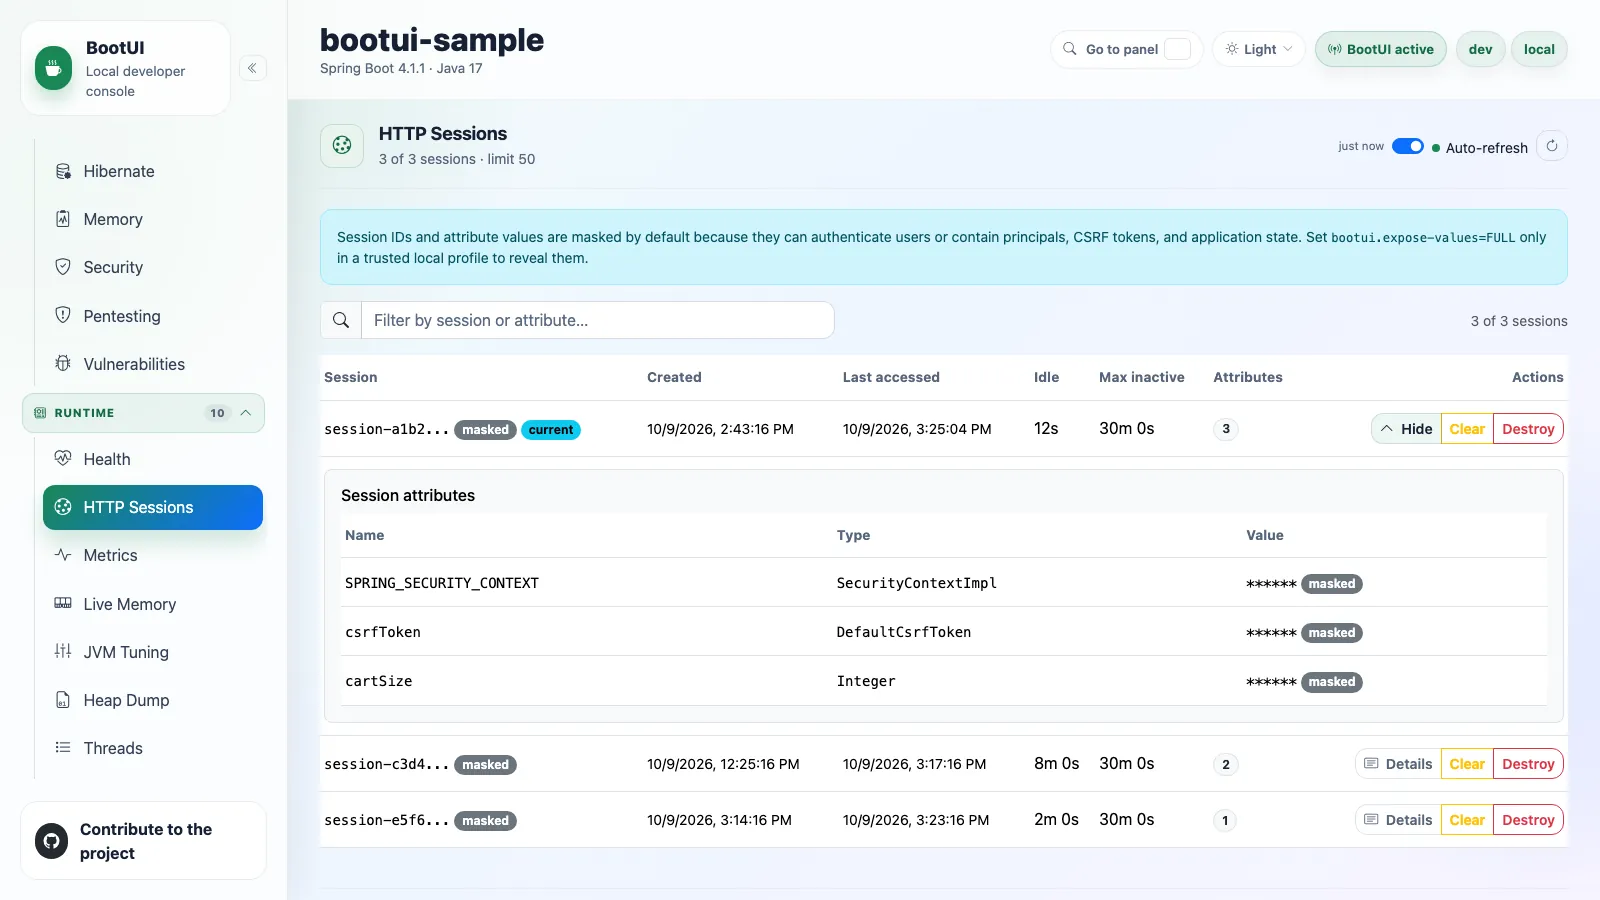
The HTTP Sessions panel lists local embedded Tomcat sessions with their creation time, last access time, idle duration, and attribute count, highlighting your current session. It returns at most 50 sessions; raise bootui.http-sessions.max-sessions for a larger bounded view.
Session identifiers are bearer credentials, so the UI receives only an opaque action key and a masked display id, and every attribute value is masked. bootui.expose-values=METADATA_ONLY keeps attribute names and types without values. FULL reveals display ids and values for local troubleshooting, with an explicit exposure warning.
Clear and destroy are confirmation-gated and disabled by read-only mode. Clear removes every attribute while keeping the session valid; destroy invalidates it. When the application is not on embedded Tomcat, the panel shows an unavailable state.
This panel is not applicable on WebFlux, where WebSession is a different, non-container-managed model.
Metrics
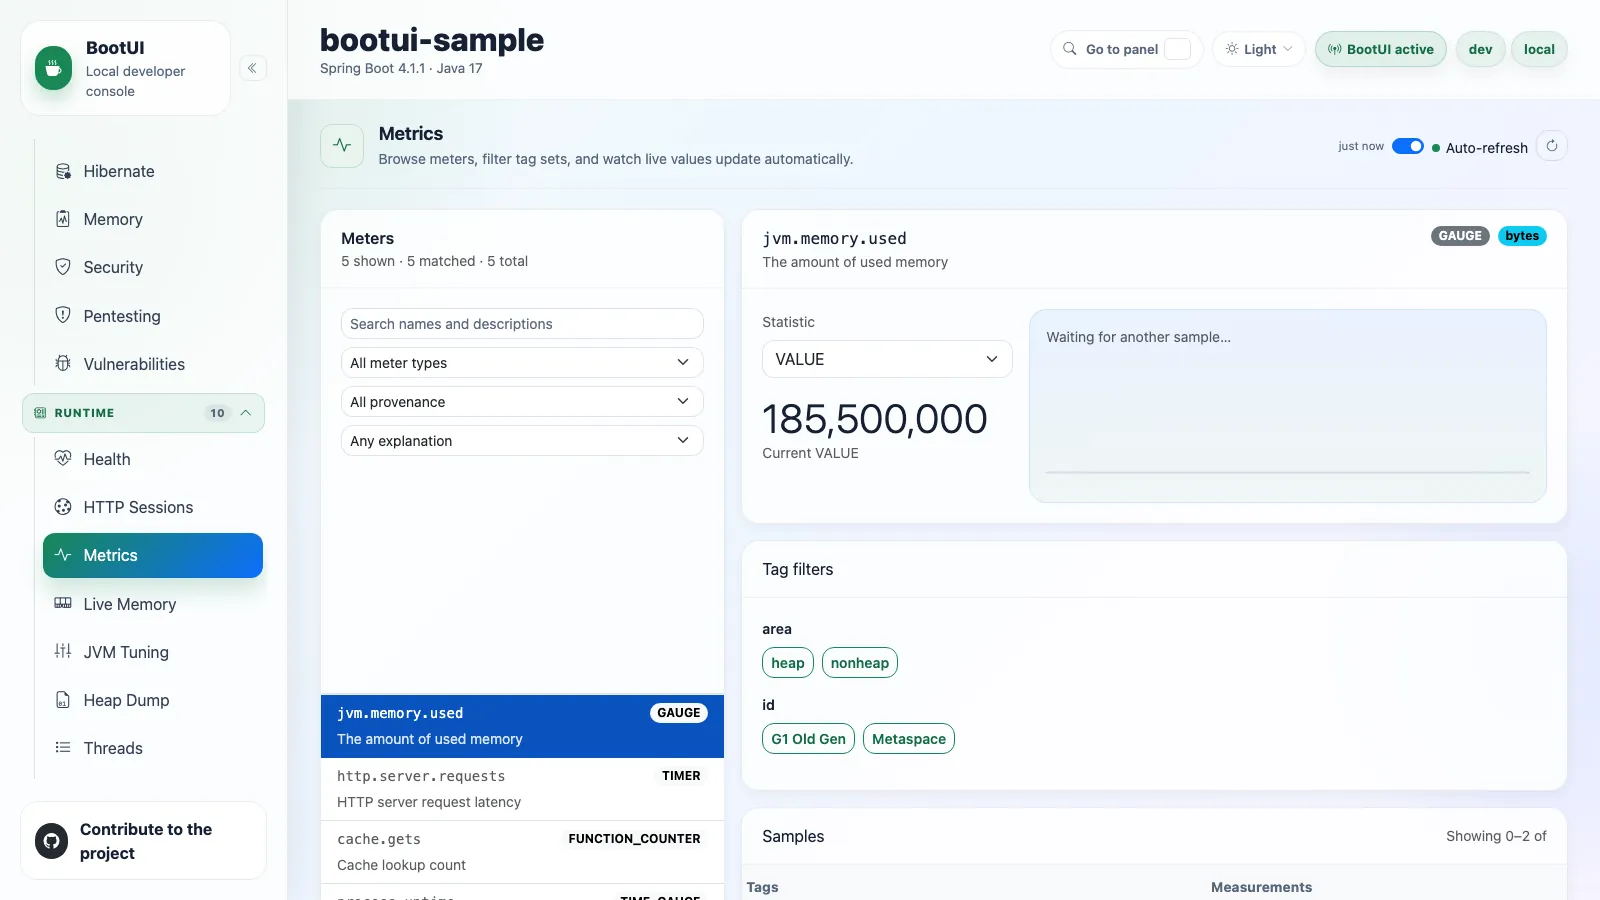
The Metrics panel browses the Micrometer meters exposed by Actuator. You can search meter names and descriptions and filter by meter type on the server, inspect descriptions, base units, tags, and measurements, and render a live chart for a selected metric and tag combination. Meters are paged, and tag-value choices are bounded to the first 100 sorted values per key with an explicit truncation badge.
Quarkus has no Actuator, so the panel reads the live composite MeterRegistry directly when the application adds a quarkus-micrometer registry, such as quarkus-micrometer-registry-prometheus. Without one it renders as unavailable. On both stacks, meters describing BootUI's own /bootui/** traffic are hidden.
Provenance grouping and honest explanations
Meters are grouped by the integration family that registered them: JVM binders, process and system binders, HTTP server and client instrumentation, datasource pools, caches, messaging clients, resilience libraries, gRPC, and framework internals, with anything unrecognized under Application / unclassified. Selecting a group filters the list on the server.
Explanations say where they come from: a meter's own registry description wins and is marked Native description, a curated, versioned catalogue of well-known families is marked BootUI catalogue, and anything else is marked Not documented. Classification matches meter names only, never tag values, so an application meter such as orders.processed is never absorbed into a curated family.
Live Memory
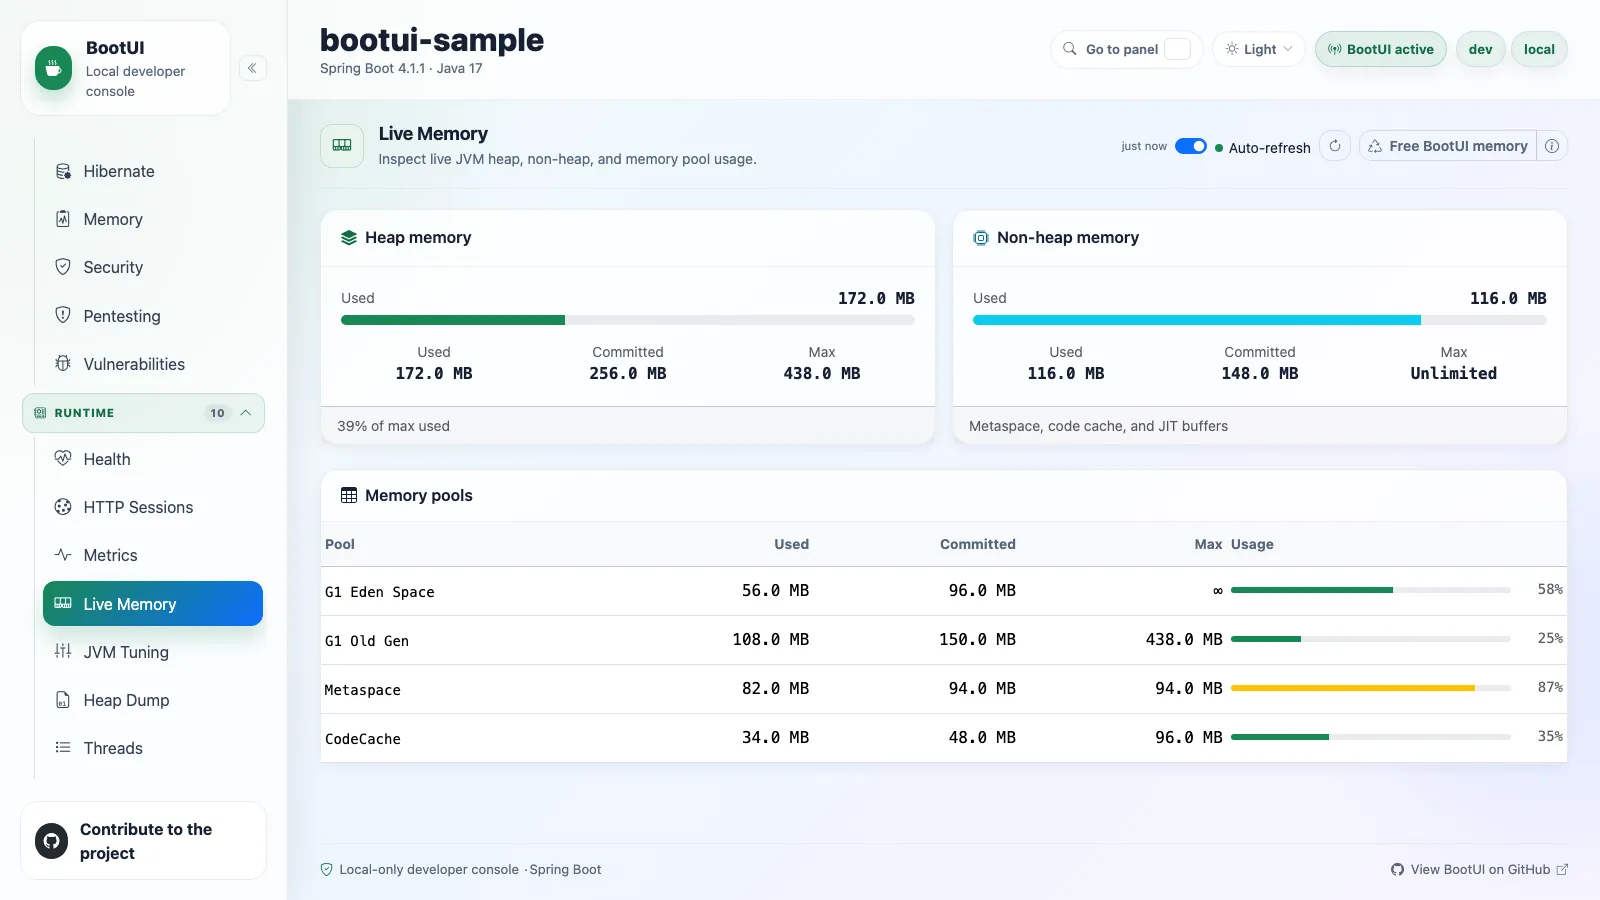
The Live Memory panel summarizes current heap and non-heap usage and memory pool utilization, so you can spot heap pressure, non-heap growth, and pool-level saturation. Sizing controls live in the JVM Tuning panel instead.
Free BootUI memory
BootUI keeps its diagnostics (the runtime journal, Live Activity, HTTP exchanges, traces, SQL statements, exceptions, and more) in your application's heap, so they inflate the numbers every memory panel analyzes. Live Memory, JVM Tuning, Heap Dump, and the Memory advisor therefore share a Low-footprint mode toggle in the panel header. Its info button explains what is cleared and what is kept.
The one-shot POST /bootui/api/live-memory/offload empties every existing BootUI capture buffer, requests a garbage collection, and shows heap used before and after, the reclaimed estimate, and the number of buffered entries cleared. It does not hold recording; use low-footprint mode below for that. Settings, configuration overrides, dismissed rules, cached scan reports, and persisted Live Activity history are kept.
Cleared data is gone
The discarded journal, traces, and captures cannot be recovered, and exception triage statuses are dropped with their groups. The garbage collection request is only a hint: the JVM may defer it, and ignores it under -XX:+DisableExplicitGC. The action is refused when bootui.read-only=true or bootui.panels.live-memory.read-only=true, and hidden when the Live Memory panel is disabled.
Low-footprint mode
Low-footprint mode turns freeing memory into a switch: POST /bootui/api/live-memory/footprint with {"enabled": true} pauses BootUI's recording, empties its buffers, and requests a garbage collection, and {"enabled": false} resumes recording. GET /bootui/api/live-memory/footprint reports the state without changing anything. The mode lives in memory only: it is off after a restart and never expires by itself. It follows the same read-only rules as freeing memory.
Exceptions, Log Tail, Live Activity, Runtime Insights, the Scorecard, HTTP Exchanges, Traces, SQL Trace, REST Client, Transactions, Kafka, RabbitMQ, JMS, WebSockets, Security Logs, Email, Fault Tolerance events, and AI Framework show a "Paused by low-footprint mode" banner for their captured data. Its Turn off low-footprint mode button calls the same endpoint and follows the Live Memory panel's read-only policy: when that policy forbids the action, the button is disabled and the banner shows the reason. A failure or a recorder that does not resume stays visible after the banner goes away.
Agents use get_low_footprint, enable_low_footprint, and disable_low_footprint, or bootui low-footprint status|enable|disable. Both switches require approval and follow Live Memory panel policy. Enabling again does not clear buffers or request GC again; disabling again is also harmless. Individually paused recorders stay paused after the global hold is released. Suspension, offload, and resume failures remain explicit.
Affected MCP/CLI results keep their existing fields and add lowFootprint with the active state, relevant component IDs, pause state, timestamp, warnings, and resume hint. This labels buffered evidence, not unaffected native statistics or agent instrumentation. Overview carries the global context. Inactive and unaffected results are unchanged; browser REST DTOs are unchanged. SQL, transaction, and REST-client resumes and new method probes are refused while held. Memory readings and scans remain usable. See agent guidance.
The BootUI Java agent is not paused. When it is attached, the response sets agentAttached and adds a warning, because these panels give better results without the agent.
What stops recording
While the mode is on, the runtime journal (with its GC event listener and resource sampler), Exceptions, Log Tail, Live Activity, Kafka, RabbitMQ, JMS, cache, fault-tolerance, scheduled-task, email, and telemetry capture, and (on Spring) the HTTP exchange, SQL, transaction, REST client, security, and WebSocket buffers record nothing. The response lists every component with suspended and an optional failure, since as sinceEpochMillis, and the offload report. Panels show what was captured before the pause, or nothing. Quarkus pauses the components it has already created and never creates a lazy one. On Spring it coexists with bootui.free-on-idle: the idle tracker never resumes buffers while the mode is on.
JVM Tuning
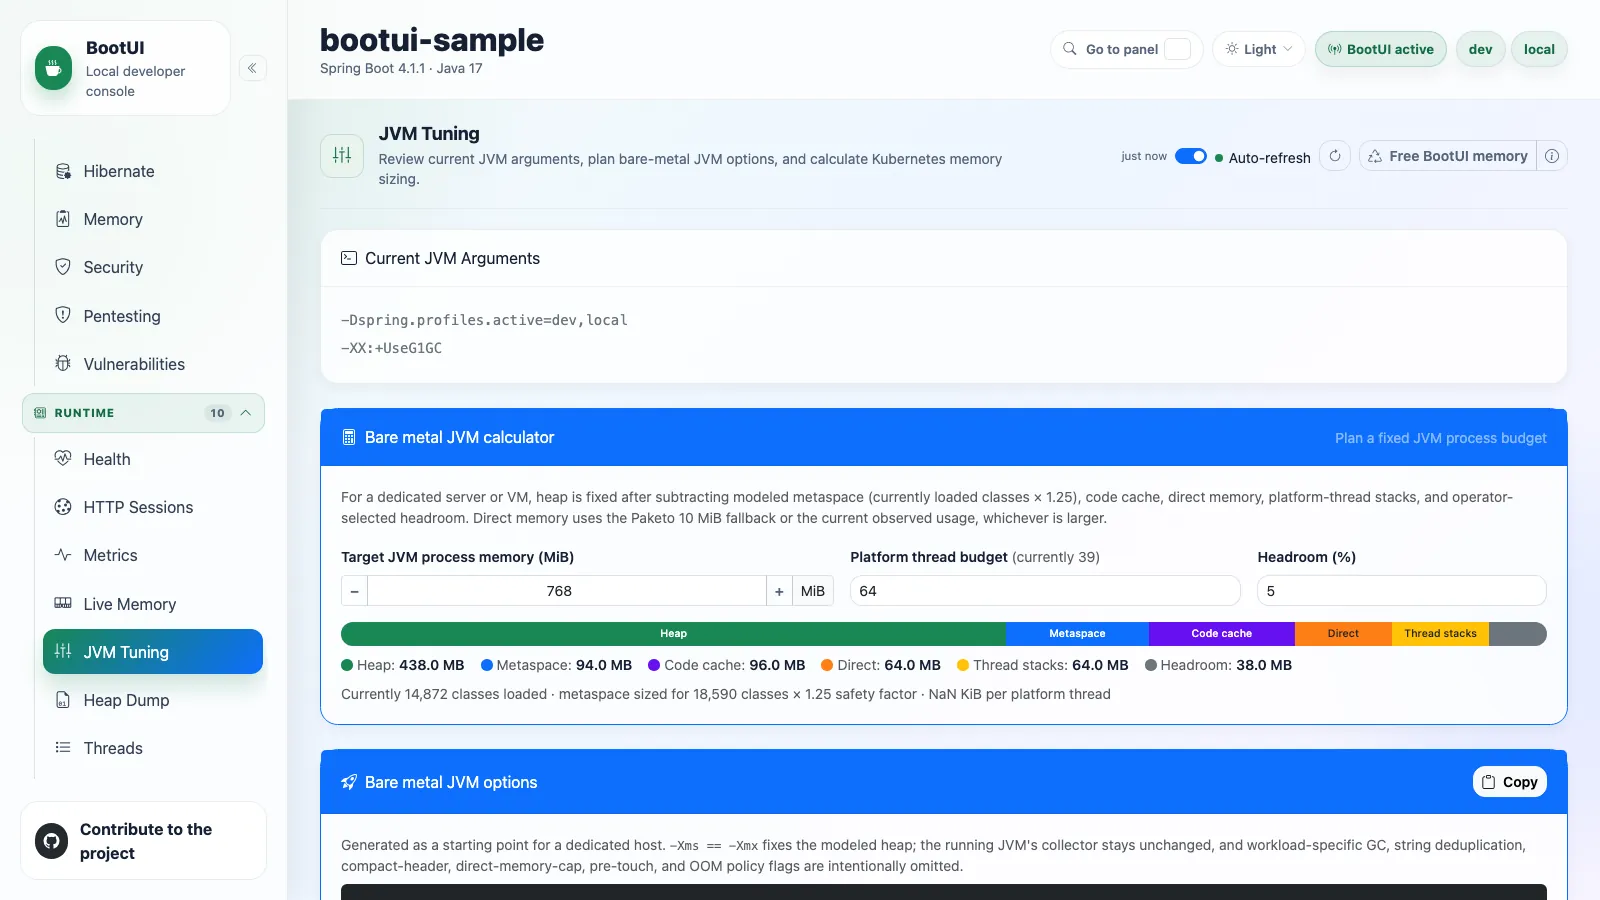
The JVM Tuning panel reviews the current JVM input arguments, explains spring.threads.virtual.enabled=true, and runs sizing calculators for dedicated hosts and for Kubernetes. It detects whether Spring virtual threads are enabled and shows an information or warning bubble.
JVM input arguments go through the same secret masking and bootui.expose-values / bootui.mask-secrets policy as configuration values, in the panel, the REST API, the get_jvm_tuning MCP tool, and the CLI. Keys stay visible and only values are replaced. Under the default MASKED mode a secret-named or secret-looking value is shown as ******, including options of -javaagent:, -agentlib:, and -agentpath:, and the shell commands of -XX:OnError and -XX:OnOutOfMemoryError are always masked. Only FULL, or MASKED with bootui.mask-secrets=false, shows the raw arguments.
The bare-metal calculator partitions a target process memory budget into heap, metaspace, code cache, direct memory, thread stacks, and headroom, then produces copyable JVM options with fixed -Xms and -Xmx. The Kubernetes calculator uses -XX:MaxRAMPercentage, -XX:MinRAMPercentage, and -XX:InitialRAMPercentage in JAVA_TOOL_OPTIONS instead of fixed heap sizes, and a health-probes toggle adds framework-default probe paths on the named container port http. Verify those paths and that port name against your deployment.
Calculator details and masking under METADATA_ONLY
METADATA_ONLYmasks every-Dsystem property value and every agent option string. It keeps-Xand-XXflags visible for tuning, with plain values such as75,512m, orsummary, but masks free-text values such as paths, commands, and-Xlogselections.- The bare-metal calculator keeps the current collector and omits workload-specific GC, direct-memory-cap, pre-touch, compact-header, string-deduplication, and out-of-memory policy flags.
- The Kubernetes calculator sets equal memory request and limit by default but labels Pod QoS
Depends on CPU, because Guaranteed QoS also needs matching non-zero CPU resources on every container. You can attempt a lower, snapshot-based Burstable request instead. - On Spring the startup probe reuses
/actuator/health/liveness, while Quarkus has a dedicated/q/health/started.
The full model is recorded in JVM-TUNING-CHECKS.md.
Not available in GraalVM native images
Heap, GC, and flag tuning does not apply to a native executable. When BootUI detects one, the panel moves to the sidebar's Disabled / unavailable group and explains why.
Heap Dump
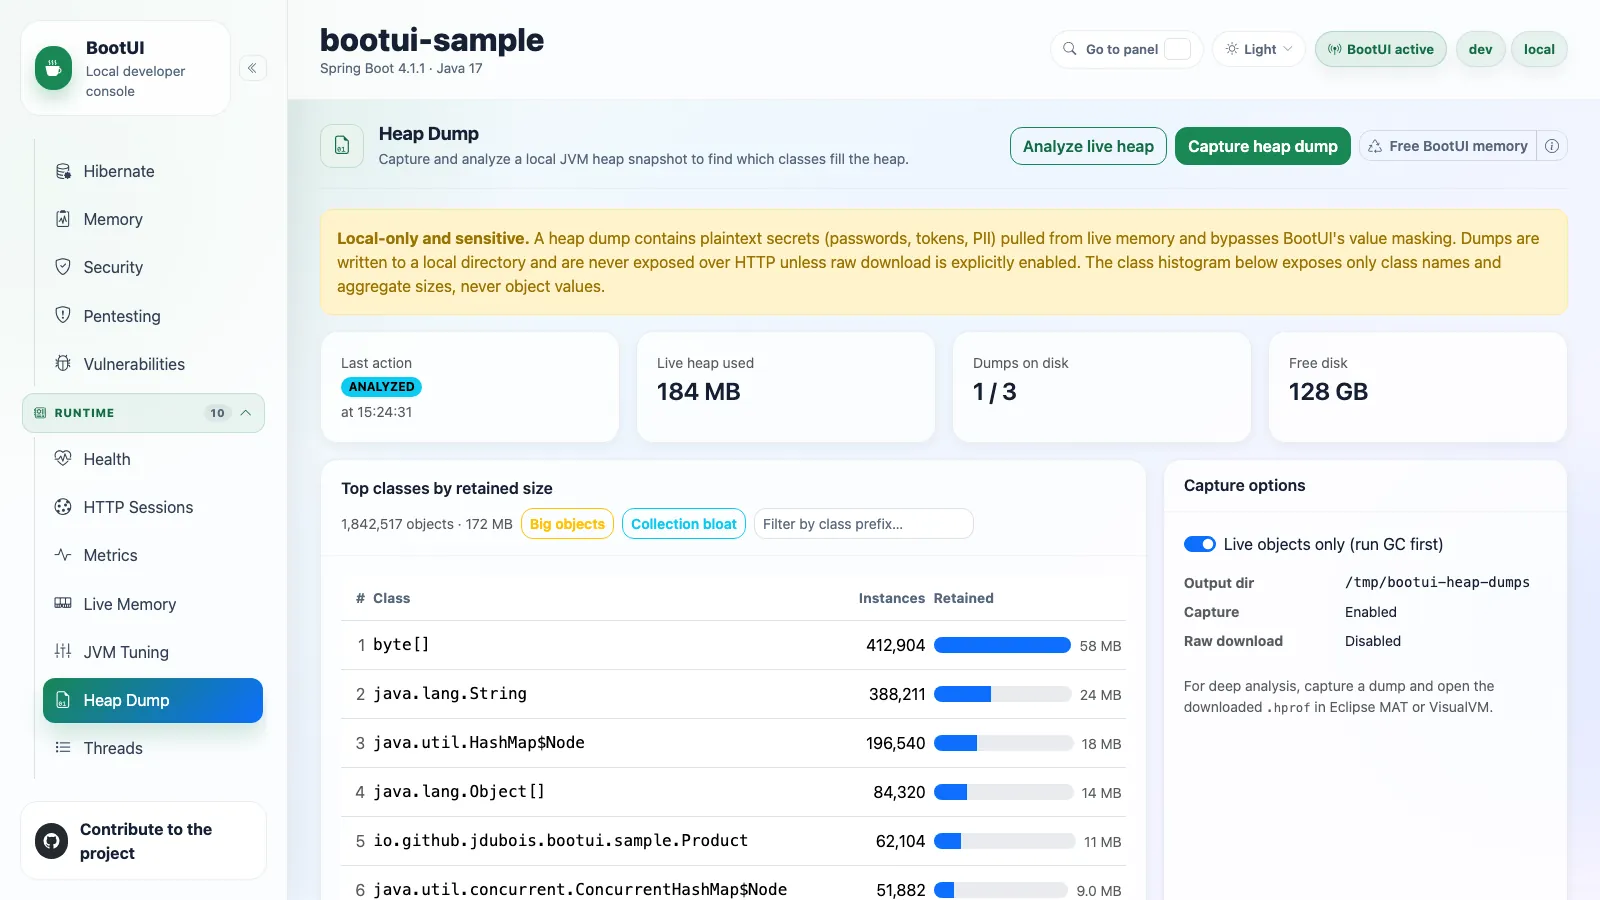
The Heap Dump panel captures local heap dumps on demand and analyzes them through a value-free class histogram, for investigating suspected leaks or unexpected retention. A confirmed capture triggers a full GC and writes an .hprof file under the configured output directory. The panel then shows live heap usage, the top retaining classes by instance count and shallow size, and the captured dumps with retention-based eviction.
Capture, live analysis, and delete share one single-flight admission; a conflicting action receives the canonical 409 busy response, while report reads remain available. Use Free BootUI memory first, so BootUI's own buffers do not crowd the histogram.
Treat every dump as sensitive
Heap dumps can contain plaintext secrets, credentials, and personal data. The panel only ever summarizes class names and sizes, never object values. Capture, analyze, and delete are mutating POST requests blocked in read-only mode, and downloading the raw .hprof file is disabled unless explicitly enabled. Use this on a local JVM only.
Threads
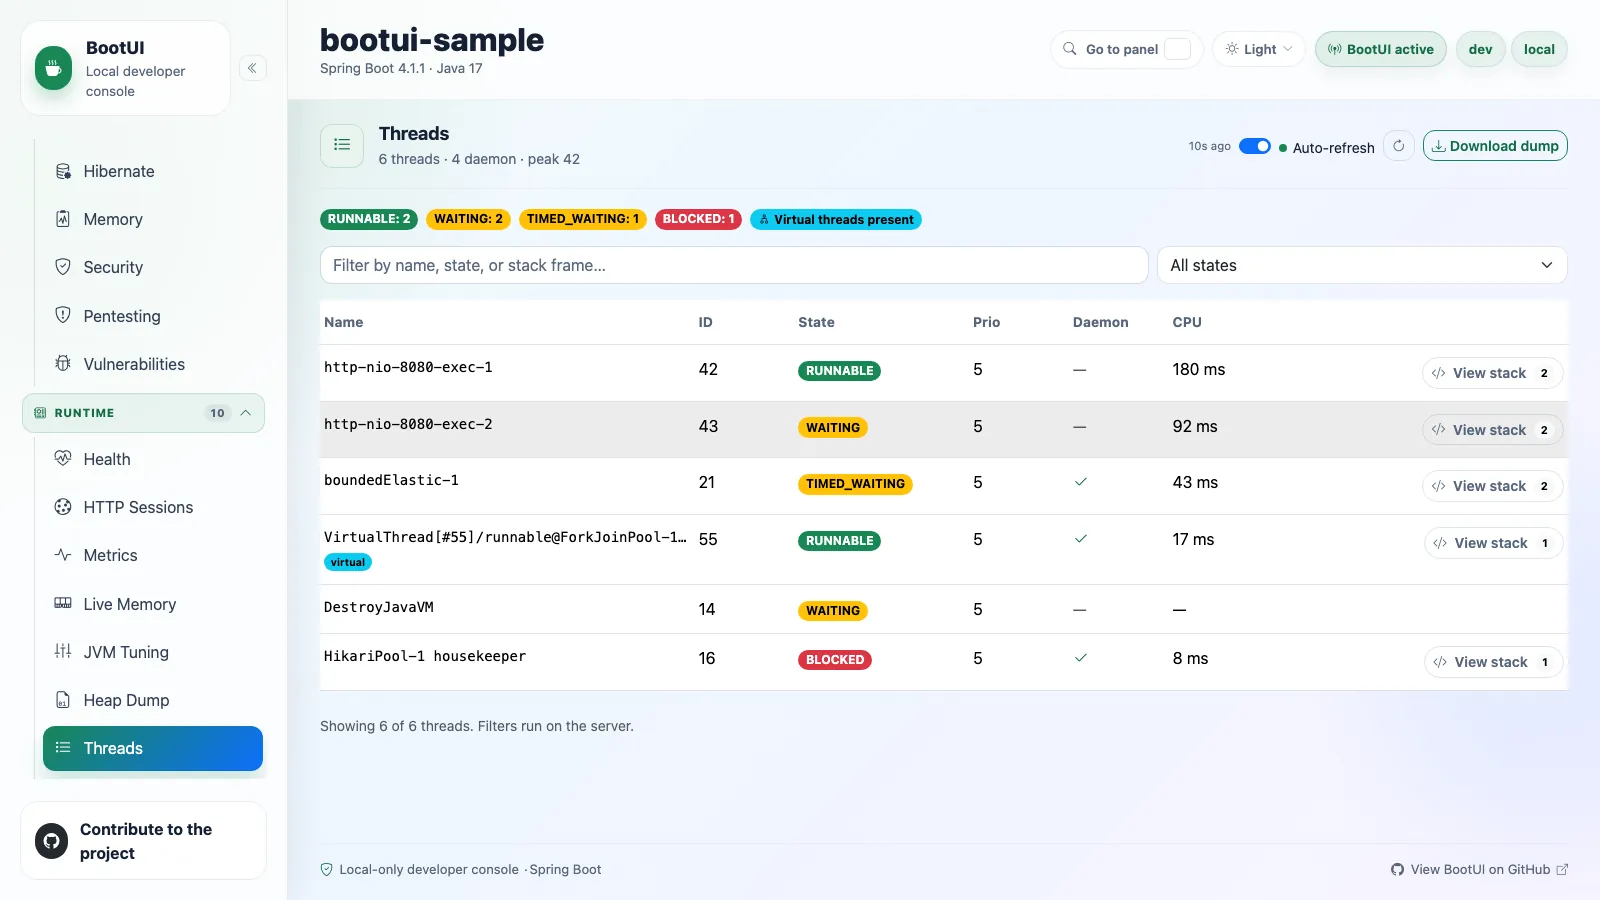
The Threads panel shows a live snapshot of the JVM's threads, read in-process through ThreadMXBean, so the application does not need to expose the Actuator threaddump endpoint. It presents counts per thread state, a flag when a deadlock is detected, and virtual-thread context on a supporting JDK. The list filters by name and state on the server with paging, and each row expands to its stack trace.
Stack frames and thread names can incidentally contain sensitive values, so names that look like secrets are masked and stack traces are omitted under metadata-only exposure. The raw text thread dump is a confirmation-gated POST download, blocked when the panel is read-only.
Startup Timeline
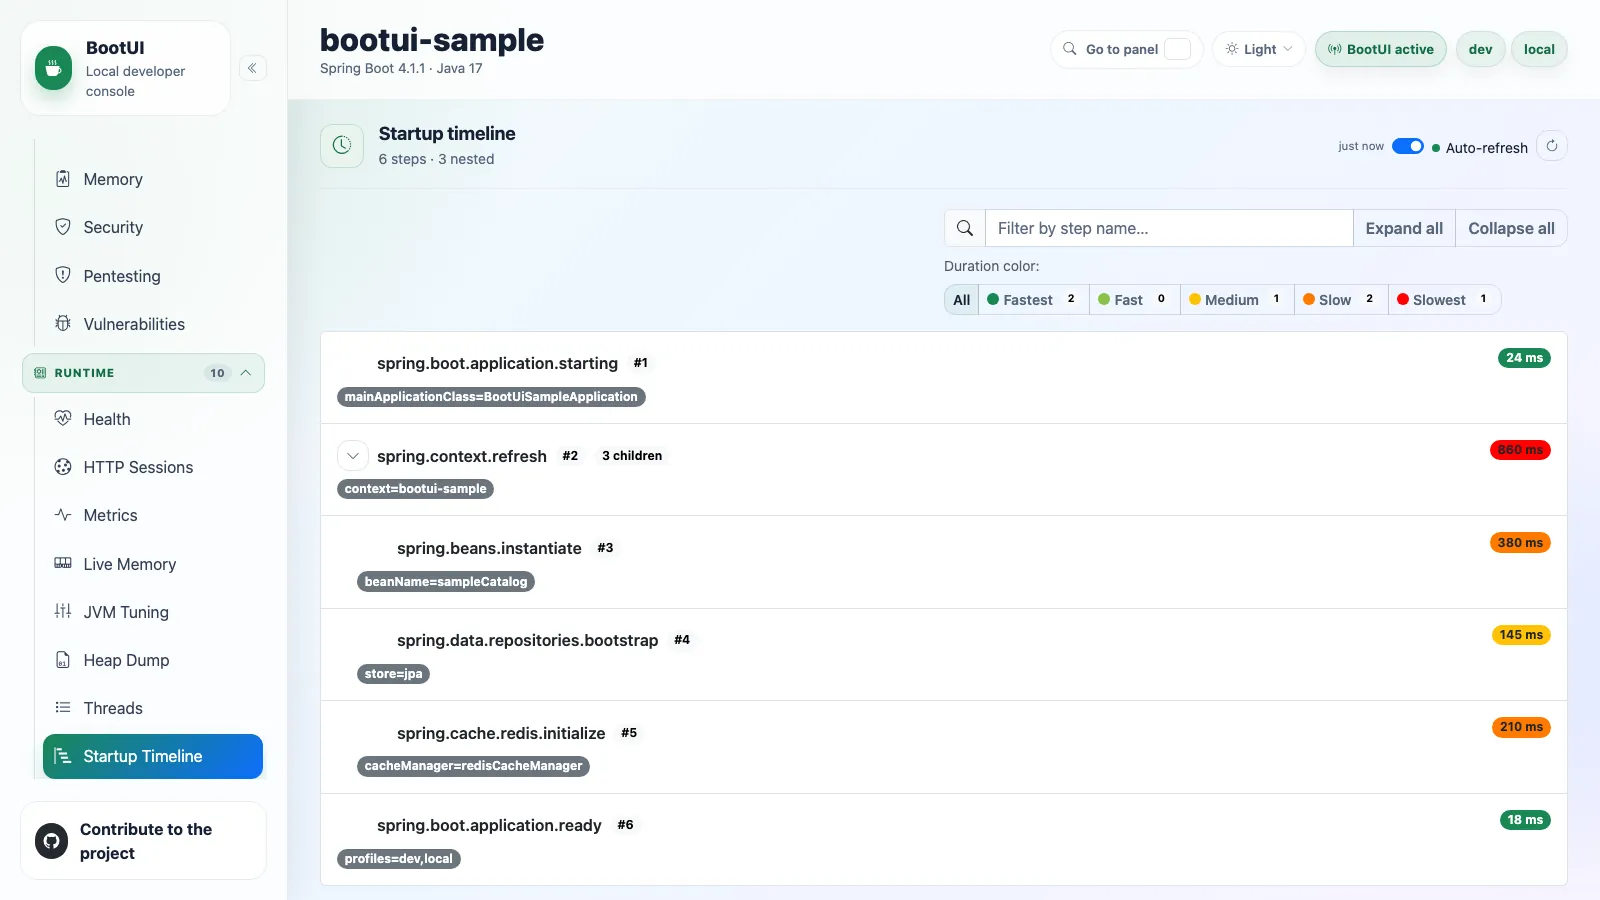
The Startup Timeline panel visualizes Spring Boot startup steps from Actuator startup data, which is how you find expensive startup phases and slow bean initialization.
When BootUI is active, the starter installs a BufferingApplicationStartup so the panel has data with no setup on your side. Disable that with bootui.startup.enabled=false, or tune the retained step count with bootui.startup.capacity. If startup data is still unavailable, the panel shows an empty state.
GraalVM
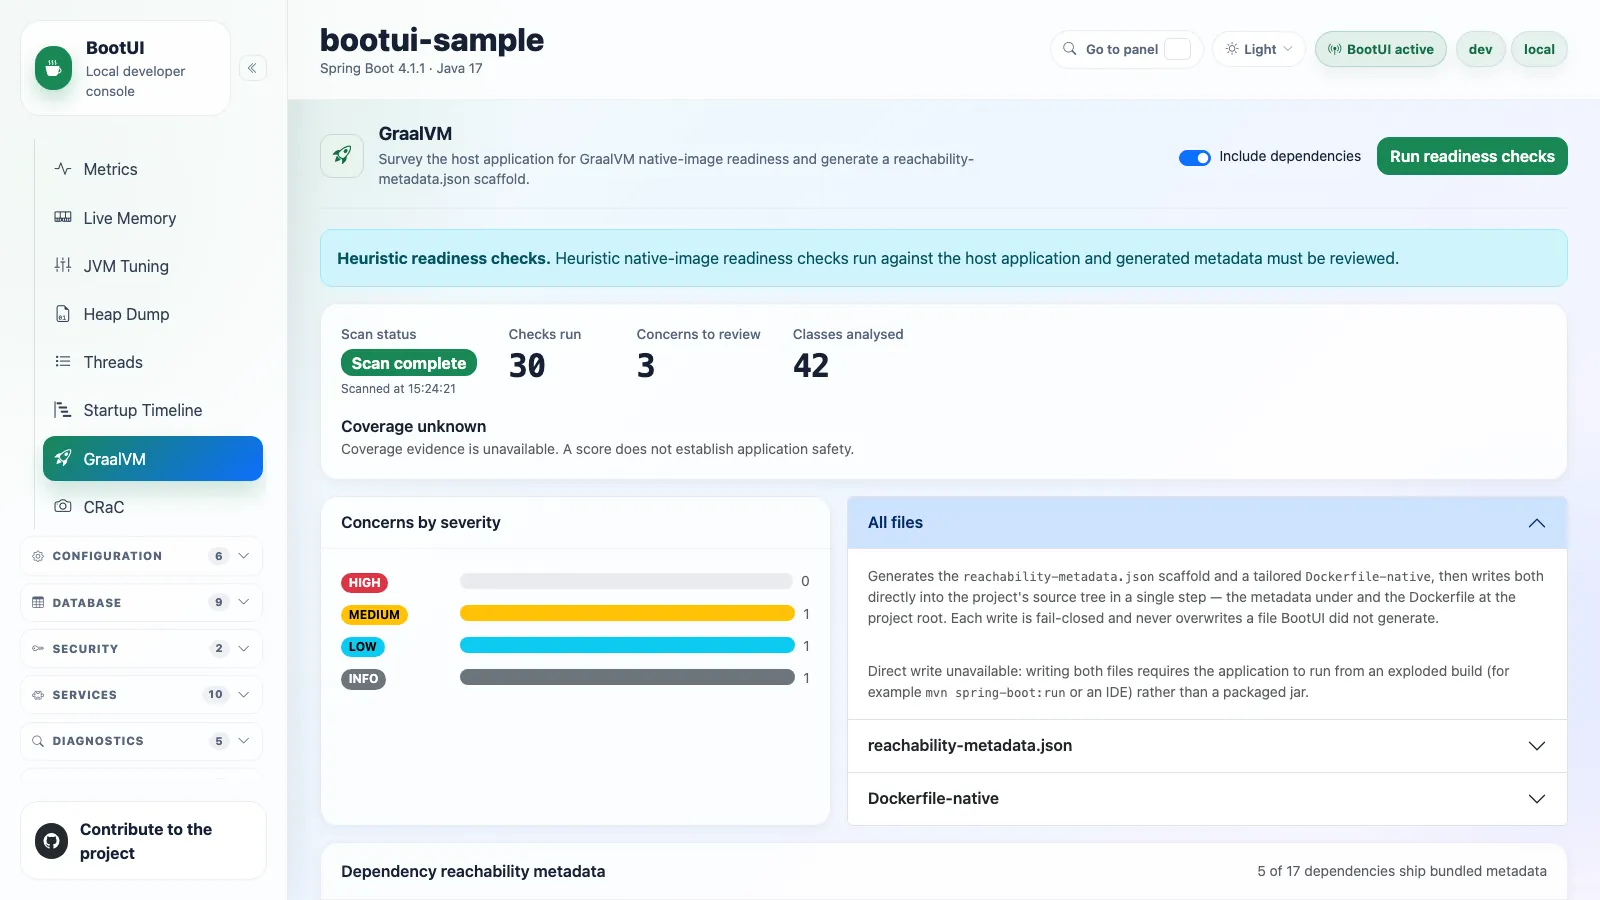
The GraalVM panel surveys the application for native-image readiness. On demand it imports the application's own classes, bounded to the detected base packages, and runs 30 curated checks: 22 GraalVM checks and 8 Spring AOT checks. After a scan you can filter the concerns by severity, category, or free text without rerunning it. The checks are heuristic review aids that complement the GraalVM tracing agent and an actual native build. See GraalVM readiness checks for the full catalogue.
This panel is unavailable when the application already runs as a native image, and not applicable on Quarkus, which compiles native images itself.
Dependency reachability metadata
With Include dependencies on (the default), the panel also reports which third-party libraries already ship reachability metadata under META-INF/native-image/. For libraries that do not, it consults Oracle's reachability metadata repository and reports the detected version as covered, partial, or none, with links to the matching entry.
That lookup is the panel's only outbound network call. It is user-initiated and time-bounded, can be aborted from the panel, and is disabled with bootui.graalvm.repository-lookup-enabled=false.
Generated project assets
The same scan generates a downloadable reachability-metadata.json scaffold in the unified schema, with condition.typeReached guards, plus a tailored multi-stage Dockerfile-native. Both can be downloaded, or written straight into the project with Write into project when BootUI detects an exploded build rather than a packaged jar. The top drawer, All files, generates and writes both in one step. Writes are fail-closed: confined under the project tree, and never overwriting a file that BootUI did not generate.
Where the scaffold is written, and how the Dockerfile-native is built
Write into project writes the metadata to src/main/resources/META-INF/native-image/<groupId>/<artifactId>-additional-hints/reachability-metadata.json, resolving coordinates from build-info.properties or the project pom.xml. The suffix keeps it from clashing with the <groupId>/<artifactId>/ directory where Spring AOT writes its hints.
BootUI detects Maven or Gradle, with or without a wrapper, and uses the matching native build command, such as ./mvnw -Pnative -DskipTests clean native:compile or ./gradlew nativeCompile. The executable is packaged into a distroless, non-root runtime image (gcr.io/distroless/base-debian12:nonroot). Some workloads still need libstdc++ or other native libraries, so test it in the exact runtime image.
CRaC
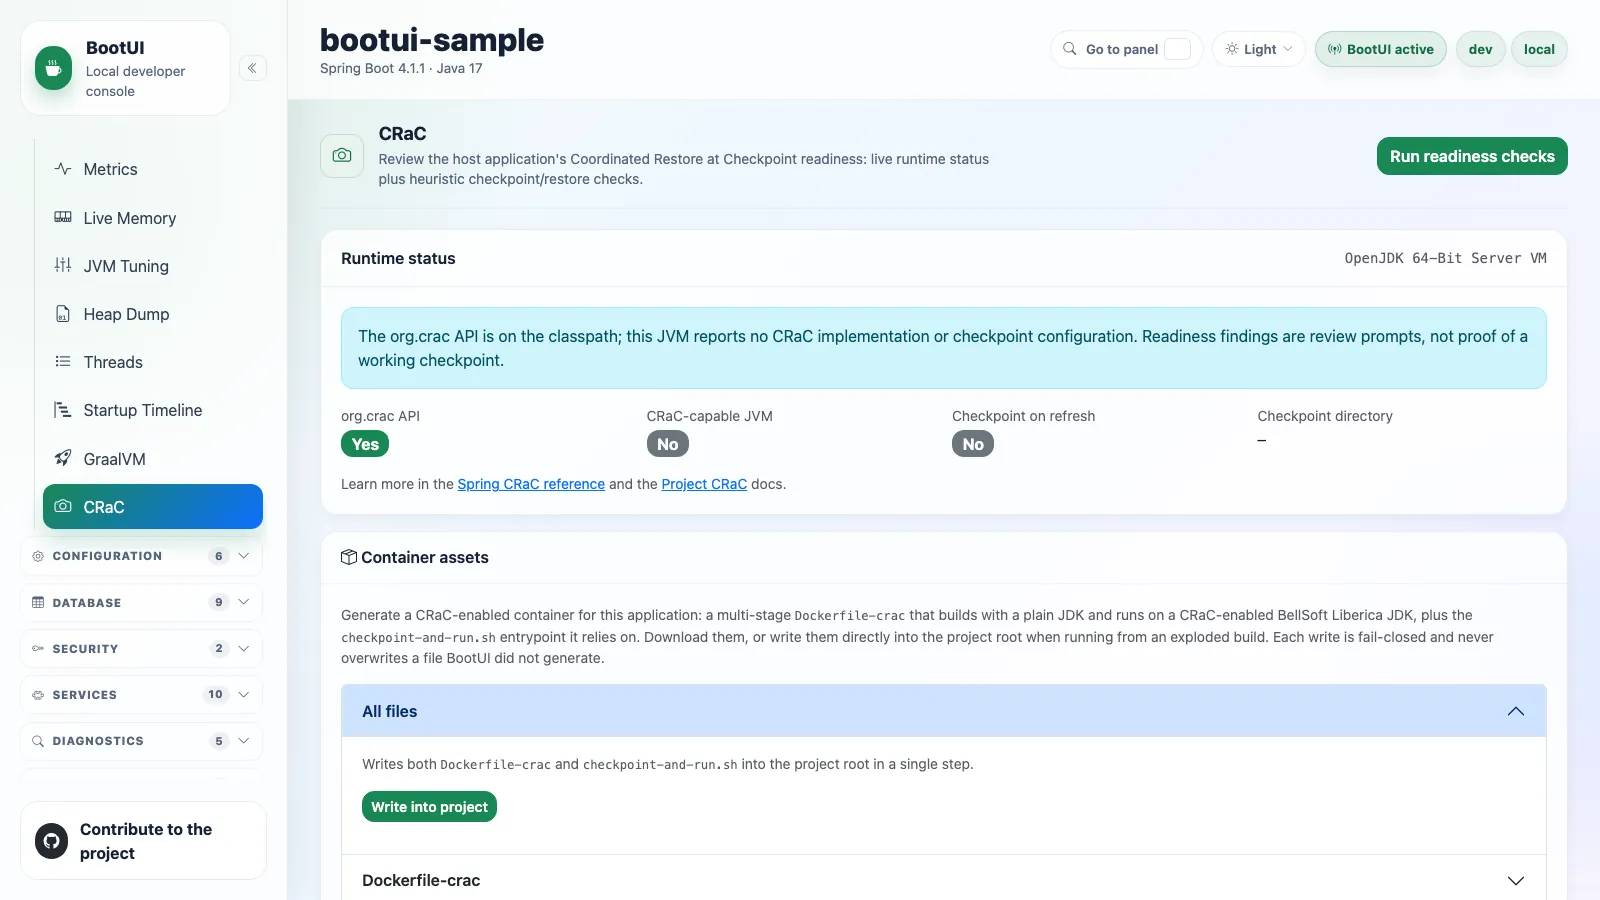
The CRaC panel reviews the application's Coordinated Restore at Checkpoint readiness, combining live runtime status with a heuristic advisor. On demand the advisor imports the application's own classes, bounded to the detected base packages, and runs 19 curated CRaC-* checks, which you can then filter in place by severity, category, or free text. They complement an actual checkpoint and restore run on a CRaC-enabled JDK. See CRaC readiness checks for the catalogue.
The panel also generates a multi-stage Dockerfile-crac that builds with a plain JDK and runs on a CRaC-enabled BellSoft Liberica JDK, plus the checkpoint-and-run.sh entrypoint, which takes a checkpoint on the first start through spring.context.checkpoint=onRefresh and restores it afterwards. Each file can be downloaded, or written into the project root from an exploded build, through the same fail-closed writer the GraalVM panel uses.
The generated run command is a local CRIU recipe
It includes CRIU's CHECKPOINT_RESTORE, SYS_PTRACE, SYS_ADMIN, and NET_ADMIN capabilities, which is a privileged, local recipe rather than a universal requirement for every CRaC engine. The on-refresh checkpoint precedes lifecycle startup, so it is not a fully warmed application. No generated fixture replaces a real checkpoint and restore test on the exact deployment environment.
What the runtime-status card and the checks cover
The runtime-status card is read-only. It shows whether the org.crac API is on the classpath and an implementation is detected, separately from whether the selected engine and host can create a real image, and the exact Spring checkpoint-on-refresh setting with bounded, exposure-aware CRaC JVM arguments. spring.context.exit=onRefresh halts the JVM before lifecycle start, so it is not a safe cleanup or restore test.
Independent runtime checks still run when application bytecode is unavailable; missing observations and failed collection are explicit, never clean results, and lazy resources are not initialized for inspection.
This panel is unavailable in GraalVM native images, since CRaC is a JVM-only feature, and not applicable on Quarkus.