Diagnostics
Traces
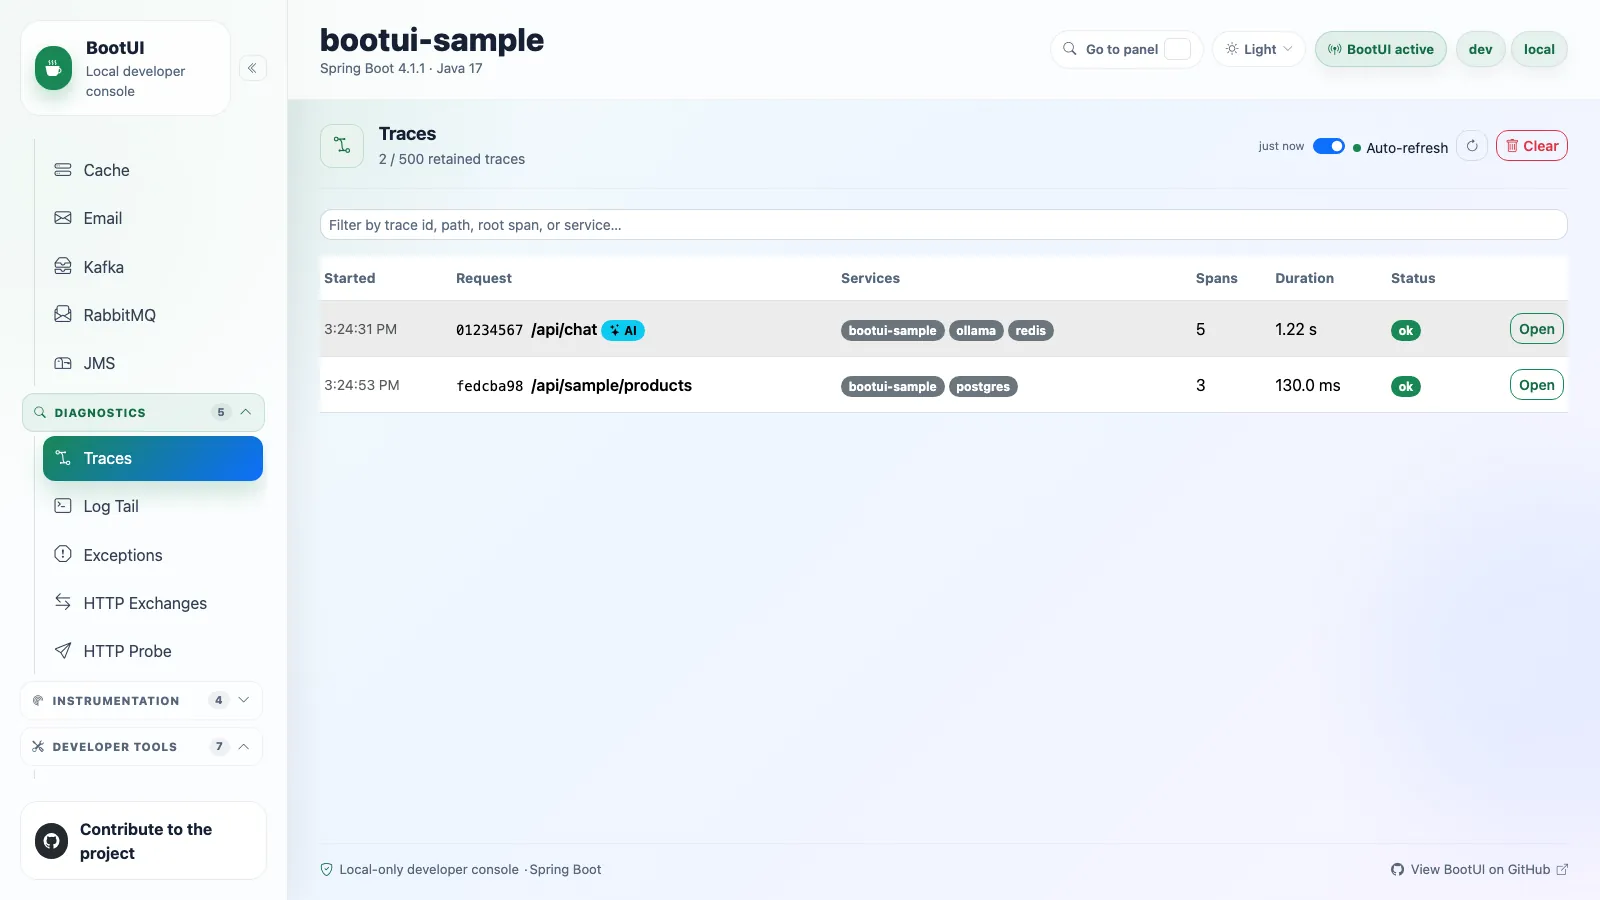
The Traces panel shows distributed tracing spans captured locally. The starter contributes the tracing dependencies and the sampling default that local development needs, so your application does not need manual management.* tracing properties.
The list shows the most recent traces with their service name, HTTP path (or the root span name), status, duration, and span count. Opening a trace renders a waterfall of its spans, so you can see latency contributions, errors, and parent and child relationships across services.
On Spring Boot, BootUI also runs an embedded OTLP/HTTP receiver at /bootui/api/otlp/v1/traces, so cooperating local services can export spans into the same in-memory store. On Quarkus, spans are captured in-process through an OpenTelemetry SpanProcessor registered only when the application depends on quarkus-opentelemetry, and there is no embedded receiver.
Trace data resets on application restart and through the panel's clear action. When bootui.telemetry.enabled=false, the sidebar dims the panel and the view shows a disabled state.
Trace value exposure
Every read applies the live bootui.expose-values and bootui.mask-secrets policy, so a runtime change takes effect on the next read without a restart. The same rule covers GET /bootui/api/traces/{id}, the trace embedded in the per-request profile, and the get_request_profile MCP tool and bootui request-profile command. MASKED (default) masks secret-like values, METADATA_ONLY omits them, and FULL shows them verbatim.
What each mode changes
- Status messages and exception events. A span's status message, its
exception.messageandexception.stacktraceattributes,error.message, and captured generative-AI content (prompts, completions, tool call arguments and results, vector query content) follow the exception message rule. - URLs.
url.full,http.url,http.target,url.query, andurl.pathare masked like the HTTP Exchanges URI: user-info is always removed, sensitive query and matrix parameter values are masked underMASKED, and query values are dropped underMETADATA_ONLY. - Headers and bound parameters. Sensitive
http.request.header.*andhttp.response.header.*values, such asauthorizationorcookie, are masked underMASKED. UnderMETADATA_ONLY, every header anddb.query.parameter.*value is omitted. - Other attributes. A string attribute whose key looks sensitive, such as
app.api_key, is masked, and any other string attribute, such asdb.statement, has secret-like assignments masked, unless the mode isFULL. Numbers and booleans are never masked.
Keys, types, names, ids, kinds, and timings are never changed. An omitted value is null. Masked text is safer to show, not guaranteed secret-free: only secrets with a recognizable shape are detected. The AI Framework chat detail applies the same rule.
Sampling defaults and log-level pins
The starter raises sampling to 100 % (management.tracing.sampling.probability=1.0). To keep that from flooding the console when the root logger is at DEBUG, BootUI pins logging.level.io.opentelemetry and logging.level.io.micrometer.tracing to INFO as overridable defaults. Set either key yourself to opt back in.
Traces from BootUI's own API are dropped on ingestion (bootui.telemetry.exclude-self-spans). The buffer is bounded by bootui.telemetry.max-traces and bootui.telemetry.max-spans-per-trace.
Log Tail
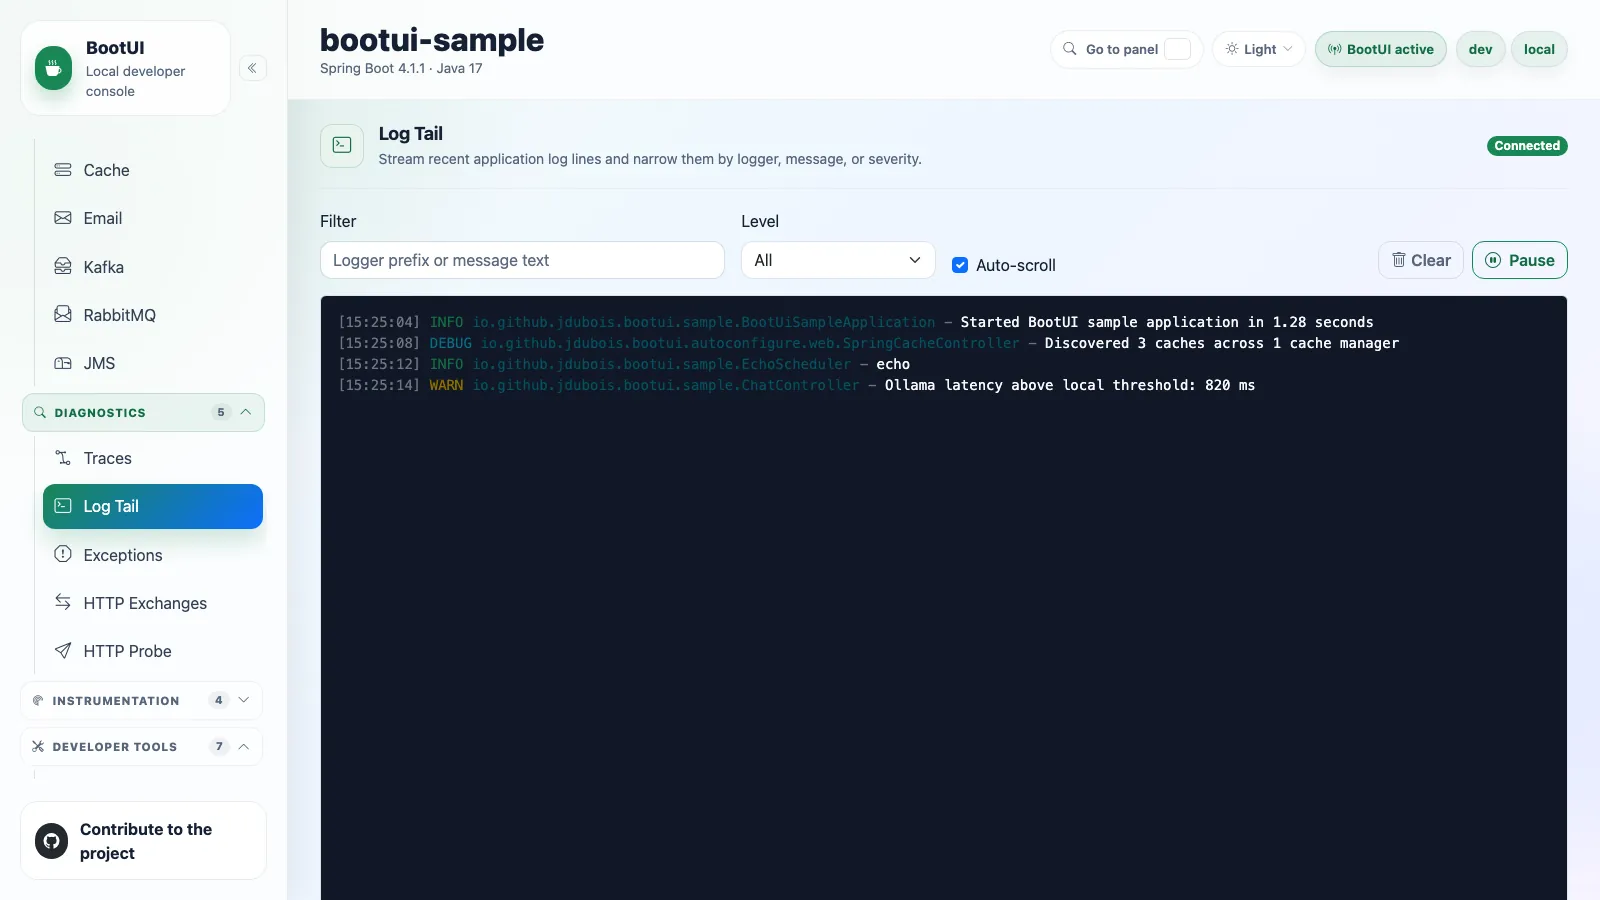
The Log Tail panel reads recent local application logs and streams new log events from the running process, for quick diagnosis without leaving the console.
Log message exposure
Log messages follow the same exposure rule as exception messages. Under the default bootui.expose-values=MASKED, the value of each secret-like key=value or key: value assignment is replaced with ******, and so is a credential after an authorization scheme or after Bearer, Basic, Negotiate, or NTLM when its shape shows it is one. Under METADATA_ONLY the message is omitted while the timestamp, level, logger, and thread remain, and the panel marks the line message omitted by policy. Only under FULL, or with bootui.mask-secrets=false, are messages shown verbatim. Treat log output as local diagnostic data.
The rule applies when a line is read, not when it is captured. It covers the recent snapshot (GET /bootui/api/log-tail/recent), the SSE stream including its replayed backlog, the get_log_tail MCP tool, and bootui logs tail. Changing the policy at runtime applies to the next snapshot and streamed line without a restart.
Masking details and limits
- Every line of a multi-line message is scanned. After an
authorizationkey, the credential that follows an HTTP scheme is masked while the key and scheme stay visible, as inAuthorization: Bearer ******. - A credential after
Bearer,Basic,Negotiate, orNTLMis masked even with no key before it, but only when its shape fits (for example aBasiccredential must decode touser:password), so prose such asBasic auth is enabledstays readable. - Any other assignment has only the first word of its value masked, and a bare token or a credential inside a connection string is not detected.
- Each line carries a
messageOmittedflag that istrueonly when the policy withheld its message.
Exceptions
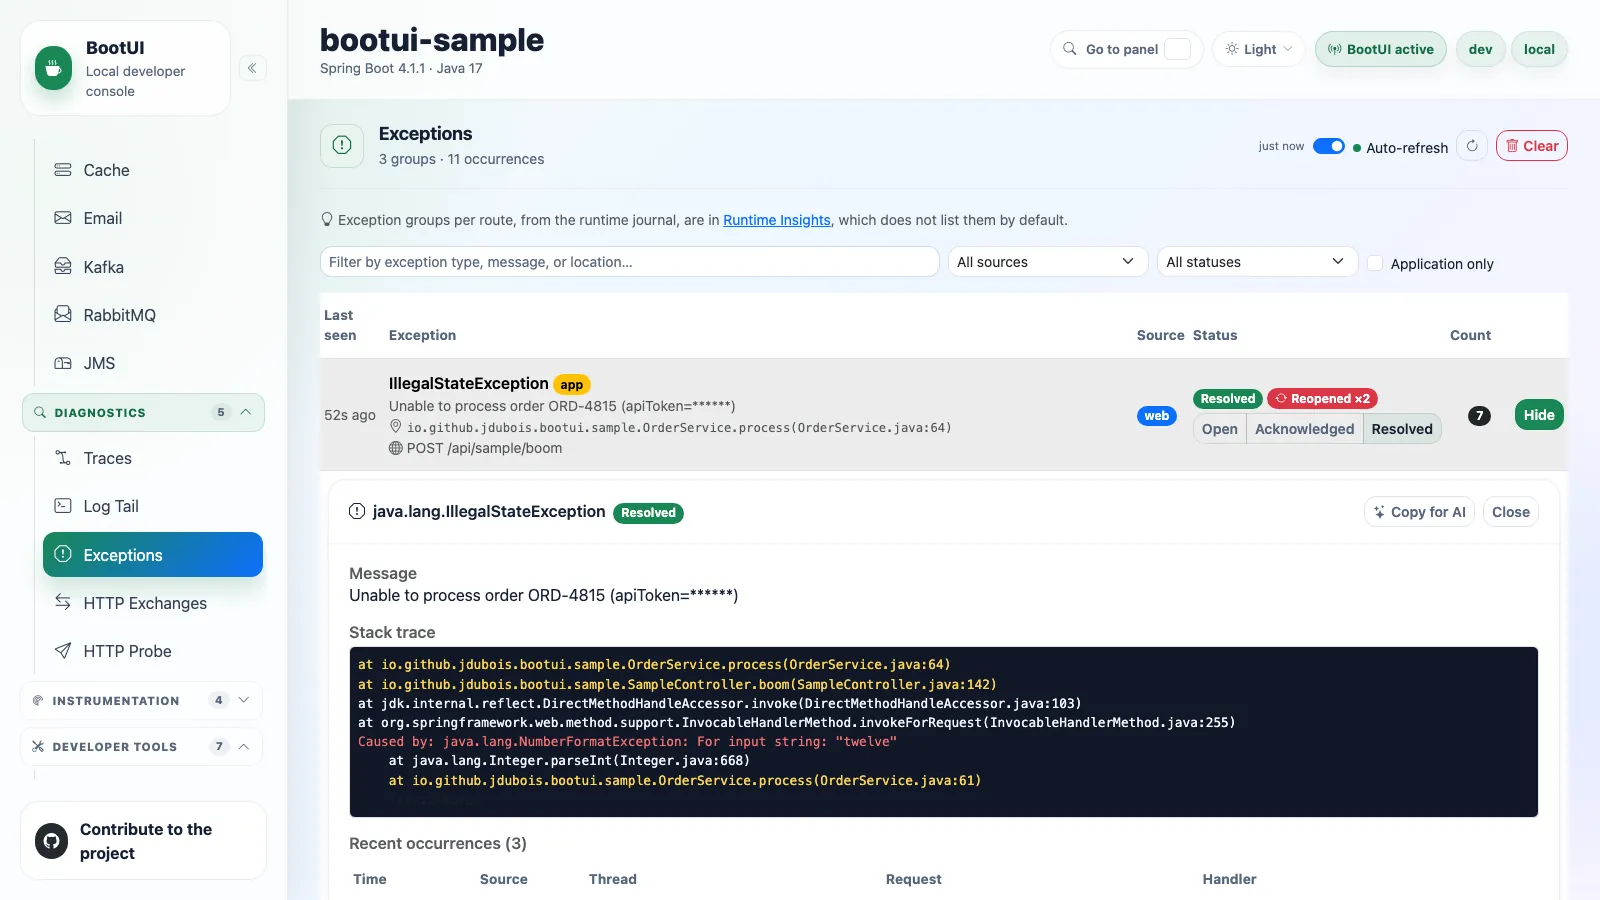
The Exceptions panel captures exceptions thrown by the running application and groups repeated failures into one entry with an occurrence count. Exception groups per route are in Runtime Insights (exception-hotspots); the link opens it with every row shown.
Each row shows the type, the latest message, first and last seen times, the originating location, and a total count. Opening a group shows the representative stack trace with application frames highlighted, the full cause chain, and the most recent occurrences with thread, source, and request context. Each occurrence carries the requestId of the request that threw it, so the profiler can attribute it exactly. The list updates live, and you can filter by text, capture source, triage status, or to application-originated exceptions only.
Links from Live Activity's request profile and EXCEPTION rows open the exact retained group with ?id=<group id>, not a class-name match. A linked request ID stays visible beside Back to request profile. If that group is no longer retained or the panel is disabled, the view explains why without selecting a different failure.
How exceptions are captured and grouped
Grouping uses a stable fingerprint derived from the exception type and the top stack frames. The stack view folds common frames (… N more).
On Spring MVC, BootUI records from a HandlerExceptionResolver that observes exceptions escaping request handlers (with method, path, and handler), and from a logback appender that picks up anything logged with a throwable from scheduled tasks, async work, or log.error("…", ex). A failure that is both handled and logged is de-duplicated by throwable identity: distinct instances count separately, the same instance or its cause twice does not.
Quarkus uses a java.util.logging handler (excluding BootUI's own loggers) and a Vert.x failure handler, wired in dev and test only. Spring Boot WebFlux uses a WebExceptionHandler at the highest precedence plus the logback appender. A @RestController's local @ExceptionHandler consumes an exception inside the WebFlux pipeline before any WebExceptionHandler sees it, so those are not captured on WebFlux; unhandled exceptions are captured identically on all stacks.
Triage status
Each group carries a triage status, changed inline with a button group:
| Status | Meaning | On a new occurrence |
|---|---|---|
| Open | Default for every new group | Keeps accumulating |
| Acknowledged | Seen, still being investigated | Keeps accumulating; never auto-transitions |
| Resolved | Believed fixed | Regresses: auto-reopens to Open |
When a Resolved group throws again, it reopens and a lifetime "Reopened ×N" counter appears next to the badge. A status filter narrows the list. POST /bootui/api/exceptions/{id}/status with {"status": "..."} changes a status; any other value returns 400 and an unknown group returns 404.
Caught in application code
With the BootUI agent's opt-in caught-exceptions sensor, the panel adds a Caught in application code section (GET /bootui/api/exceptions/caught, and caughtInCode in the report and MCP get_exceptions). It groups exceptions that application handlers caught by route, handler, and caught class, and counts each occurrence under one outcome, from Rethrown and Logged to Unknown (incomplete evidence) and Settling (its request ended less than five seconds ago).
All outcomes
| Outcome | What BootUI saw |
|---|---|
| Rethrown | The exception left the method by a throw, as is or as a cause, or was caught again |
| Replaced | The handler's straight-line code throws another exception without it |
| Reported | The exception, or a wrapper of it, reached the framework's error handling |
| Logged | It was logged at WARN or above, or a WARN was logged on the catching thread right after, before it caught anything else |
| Handed on | The handler passed it on as an error value: a failed future, an error signal, a deferred error result |
| Re-interrupted | The handler restored the thread's interrupt |
| Retried | A later attempt at the same handler in the same request was rethrown, reported, or logged |
| Not seen rethrown or logged at WARN or above | None of these, while the evidence was complete |
| Unknown | The evidence was incomplete; the row names the most frequent reason |
| Settling | Its request ended less than five seconds ago, or work it handed over still runs |
A row is a finding when occurrences not seen rethrown or logged came from at least three requests, or from one for an SQL, I/O, or data-access exception. A finding states a fact, never a verdict: BootUI never calls an exception swallowed.
When an occurrence counts as complete evidence, and known limits
An occurrence is judged only when it was caught under a retained HTTP request that started after the last Clear recording, lost no record in the journal or the agent, did not go asynchronous or get cancelled, and ran no work after the response, and BootUI's log appender saw every WARN log. Otherwise the occurrence is unknown, with the first missing piece as its reason. With HTTP Exchanges hidden, rows name no route or request; with Log Tail hidden, logs are not consulted.
Known limits: a task queued longer than the five-second settle window is not yet followed; an exception the panel's capture ignores or deduplicates carries no identity of its own; and on Spring, java.util.logging must be bridged to Logback, as Spring Boot does, or every occurrence stays unknown.
Exposure and bounds
Exception messages follow the same exposure policy as the rest of BootUI. Under the default bootui.expose-values=MASKED they are scrubbed of secret-like assignments and authorization credentials exactly as log messages are, under METADATA_ONLY they are omitted, and only under FULL are they shown verbatim. Request paths are captured without their query string, and stack frames carry only class, method, file, and line.
The in-memory store resets on restart and through the panel's clear action, which honors the read-only setting. It is bounded by three properties:
| Property | Default | Bounds |
|---|---|---|
bootui.exceptions.max-groups | 100 | Groups retained, evicting the least recently seen |
bootui.exceptions.max-occurrences-per-group | 25 | Occurrences kept per group |
bootui.exceptions.max-stack-frames | 50 | Frames kept per stack trace |
Copy for AI
An open group offers Copy for AI, which turns the detail into one Markdown document to paste into an agent: the group summary, its exposure-governed message, the stack trace and cause chain with application frames marked, recent occurrences, and, when Live Activity can still profile the latest request, that request's timing and correlated SQL with N+1 groups.
The full document is shown before anything is copied, with a list of what it leaves out (masked values, withheld messages, bounded frames, or why no SQL could be added). Preparing it reads only existing Live Activity endpoints; the copy itself sends nothing and changes no state. It renders through the same helper as the profile drawer's export.
HTTP Exchanges
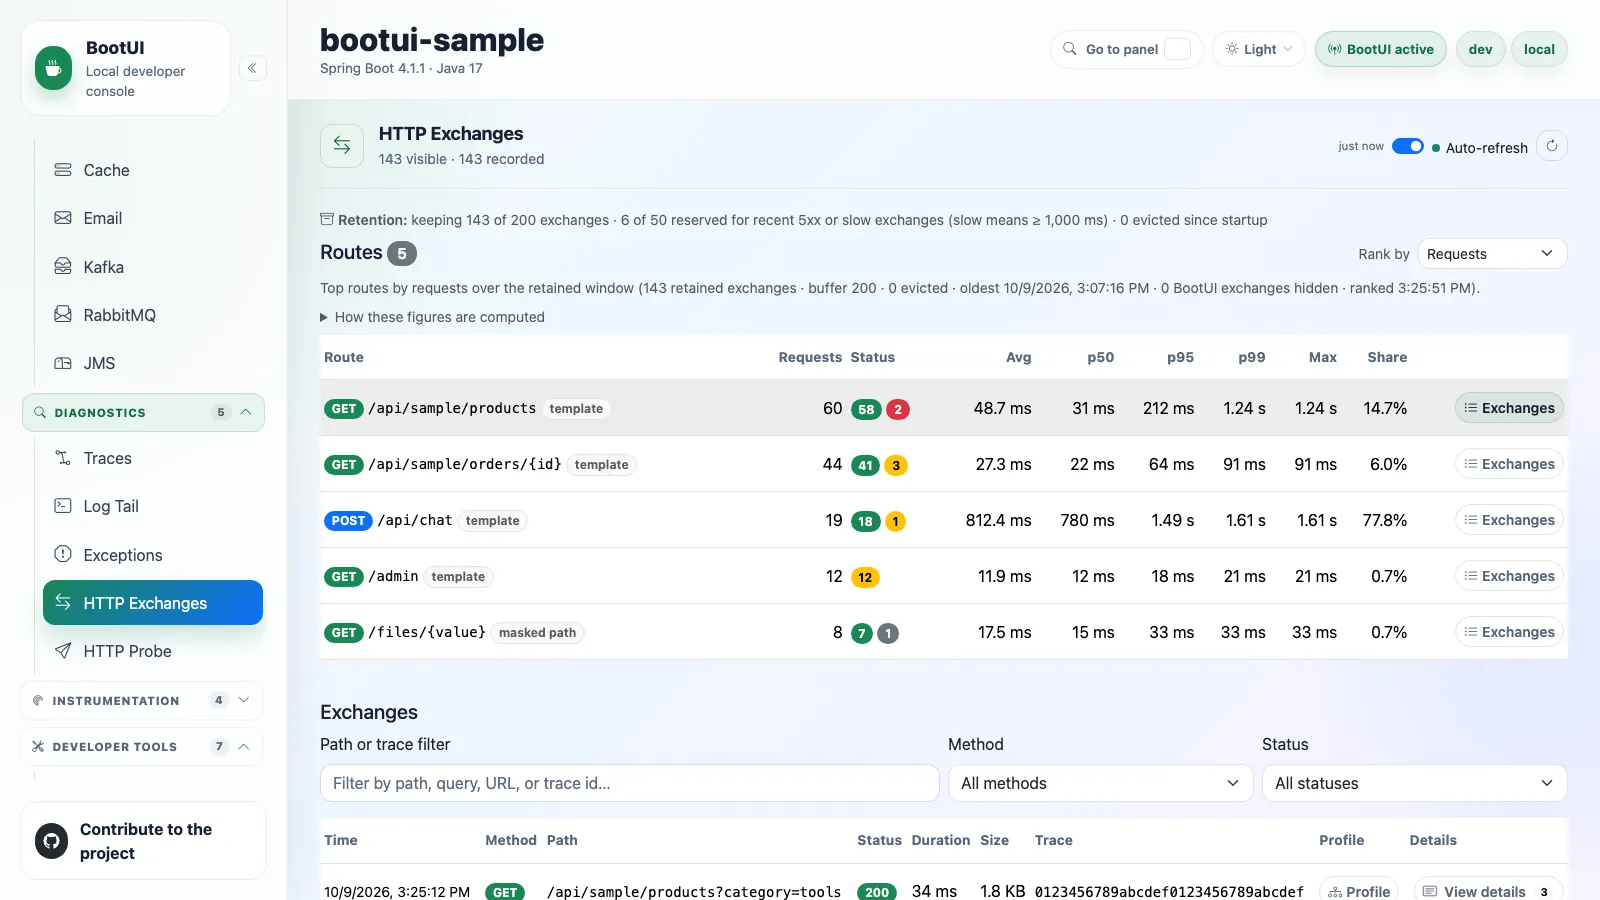
The HTTP Exchanges panel records recent inbound requests: timestamp, method, path, status, duration, response size when Content-Length is present, and trace identifiers from common propagation headers. Expanding a row shows the request and response headers, with secret-like headers and query parameters masked unless bootui.expose-values=FULL. Every exchange carries its route, shown under its path when the two differ, and a Profile link that opens the request in Live Activity.
BootUI's own requests are not recorded while bootui.monitoring.exclude-self is on (the default). The buffer retains 200 exchanges by default; change it with bootui.http-exchanges.max-exchanges, effective on the next restart.
How exchanges are recorded on each stack
On Spring Boot, BootUI contributes its own bounded HttpExchangeRepository and the Actuator filter that records into it when the panel is enabled and the application has not defined a repository. If none is available, the panel says so. Quarkus has no Actuator repository, so a small Vert.x route filter, wired in dev and test only, samples each completed request into a bounded buffer sized by the same property. Masking, trace-id extraction, self-exclusion, and paging run through the shared engine, so the wire format is identical.
Every exchange also carries BootUI's own requestId, generated when the request starts, with or without OpenTelemetry. It follows the request across threads on every stack, is the exchange's id, and is matched by the search field. An exchange recorded without one, for example by an application-provided repository, keeps a hash of the exchange as id.
WebFlux and Quarkus require an exact request id or an unambiguous trace id for a buffer-backed profile and explain when neither is available.
Failure-preserving retention
A burst of successful requests would otherwise evict the one failure you came to investigate. Every BootUI-owned capture buffer, HTTP Exchanges, SQL Trace, and REST Client, therefore reserves a share of its capacity for failed and slow records:
| Buffer | Reserved for | Slow threshold |
|---|---|---|
| HTTP Exchanges | 5xx responses and requests at or above the slow threshold | bootui.activity.request-slow-threshold-ms (1000) |
| SQL Trace | Failed statements and statements at or above the slow threshold | bootui.sql-trace.slow-query-threshold-millis (100) |
| REST Client | Calls that failed, received a 4xx or 5xx response, or took at least the slow threshold | bootui.rest-client-trace.slow-call-threshold-millis (1000) |
Routine records are evicted first. The share is 25% of each buffer by default and is carved out of the existing capacity. Set bootui.http-exchanges.reserved-share-percent, bootui.sql-trace.reserved-share-percent, or bootui.rest-client-trace.reserved-share-percent to change it, or to 0 to evict strictly oldest first. A slow threshold of 0 disables slow classification, so only failures are reserved.
Each panel states its window above the list: records kept, how many sit in the reserved share, and how many were evicted since startup. The same counts are in the retention object of each report, and so in get_http_exchanges, get_sql_traces, and get_rest_client_traces for MCP clients and the bootui CLI.
Durable history and application-provided repositories
With Live Activity durable history on, persistence recognizes a reserved record by the same rule and slow threshold as its buffer, so a reserved record that reappears after being pushed out of the stream is not stored twice. Persistence remembers each kind of entry separately, so a burst of another kind cannot make it forget a reserved request; only more than bootui.activity.persistence.buffer-max-entries newer records of the same kind can.
On Spring Boot these guarantees apply only while BootUI owns recording. When the application defines its own HttpExchangeRepository, BootUI leaves it untouched. When it defines its own HttpExchangesFilter or HttpExchangesWebFilter, BootUI keeps every exchange it is given, oldest evicted first, and hides its own requests at read time. In both cases the panel reports retention as managed by the application.
Route rankings
Above the exchange list, a route table summarizes the retained window. Each row is one method and route, with its request count; 2xx, 3xx, 4xx, and 5xx counts; average, p50, p95, p99, and maximum duration; and share of retained request time. Rank by orders the table by requests, total time, p95, slowest request, or errors. Exchanges filters the list below to that route, and Show every route clears it.
A route is resolved exactly as SQL Trace attributes database time, and each row says which source it came from:
| Source | Meaning |
|---|---|
template | The handler pattern Spring MVC or Spring WebFlux matched, such as /api/orders/{id}. |
declared | The single best route the application declares in its mappings. Ties resolve to no template. |
masked path | No template matched, so every path segment that reads like a value is replaced with {value}. |
GET /bootui/api/http-exchanges/routes serves the rankings, ?route=<id> pins one route's row, and GET /bootui/api/http-exchanges?route=<id> lists that route's exchanges. Agents use the get_http_routes MCP tool, and the command line bootui http routes.
Route resolution details
- A template is shown the same way whichever source produced it, so
{id:[0-9]+}reads{id}and a route never splits in two. Catch-alls such as/**stay as declared. Query strings are never part of a route. - Quarkus has no runtime route template, so routes come from the declared JAX-RS mappings under
quarkus.http.root-pathandquarkus.rest.path; a prefix contributed only by@ApplicationPathfalls back to masked paths. - Spring WebFlux records the matched pattern through the OpenTelemetry integration the starter includes; without it, routes fall back to masked paths and the panel says so.
- With Spring for GraphQL, BootUI adds the parsed operation type and name to the route, such as
/graphql (query ProductList), never its variables or selection. It needs Spring Boot's observation support. - A masked path masks every segment that a matching declaration marks as a parameter.
How the figures are bounded
- Every figure covers only the retained, visible exchanges, not lifetime metrics; the Metrics panel's
http.server.requestsmeter covers the application's lifetime. The line above the table states the evidence window. - Percentiles are exact nearest-rank values, computed by the same helper as SQL Trace and the Live Activity KPIs.
- The response returns each criterion's top 25 routes plus any route a link names, and the panel says how many are not shown. Rankings refresh every 30 seconds while the list follows auto-refresh.
Copy as cURL
Row details offer Copy as cURL, which turns the retained metadata into a command template, not a byte-for-byte replay. Copying runs entirely in the browser: no request is sent and nothing is written back. The command is shown in full before you copy it.
What the command changes, and why
- Query-parameter names are preserved, but every value becomes a
VALUEplaceholder. A masked name, or a segment with no=, is dropped and reported. - Only
Accept,Accept-Language,Cache-Control,Content-Type, andUser-Agentare copied, and only while their values are exposed and unmasked. Authorization, cookies, proxy credentials, API keys, forwarding and tracing headers, and unknown custom headers are omitted under every mode, includingFULL. - BootUI never captures request bodies; body-carrying methods say a body may have existed and invite you to add your own
--data. - The URL, method, and headers are POSIX single-quoted, and credentials embedded in a recorded URL are dropped. The path is copied as recorded, so a traversal probe such as
/a/%2e%2e/adminstays visible, and--globoffkeeps brackets literal.HEADuses-I. - With no absolute
http(s)URL or no recognizable method, the action is deactivated and says why.
HTTP Probe
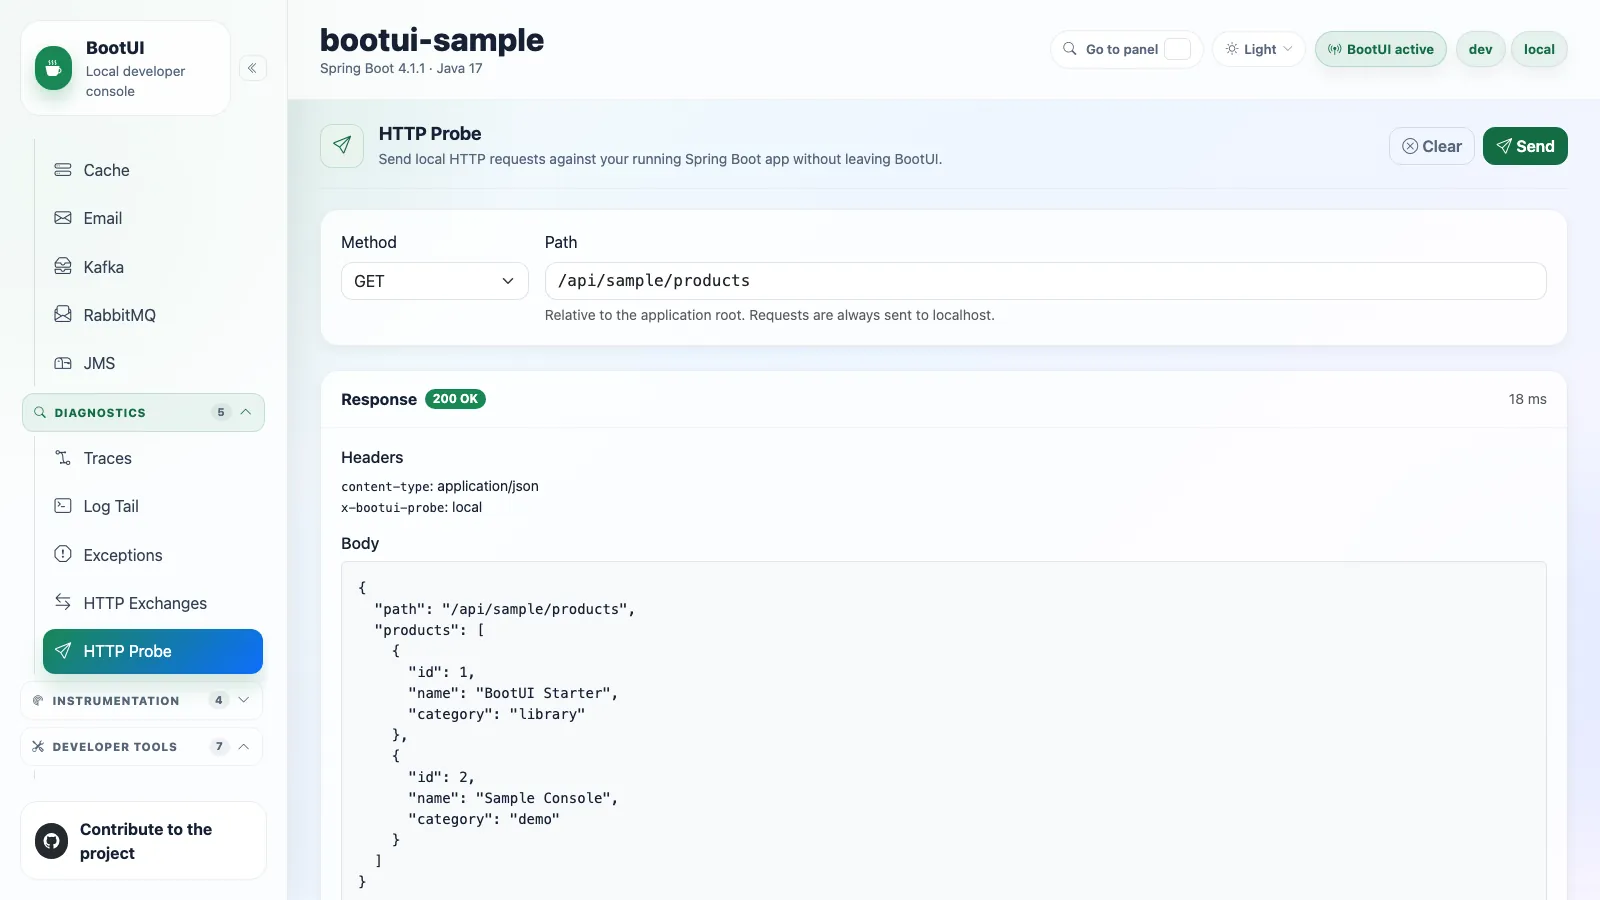
The HTTP Probe panel sends local-only requests to the running application and shows the response status, headers, duration, and body. The probe always targets the application's own loopback address, so it can never reach an external host, and as a state-changing action it is gated by the same localhost-only safety floor as every other write.
Probe input is bounded, measured in UTF-8 bytes and checked before anything is sent:
| Input | Ceiling |
|---|---|
| Request body | 64 KiB |
| Path | 2 KiB |
| Headers | 50 entries, 256 bytes per name, 8 KiB per value, 32 KiB combined |
| Method | 32 bytes |
Exceeding a ceiling is rejected with the canonical 400 and {"error": ...} body. A probe that runs and fails, through a refused connection or a timeout, is reported as a probe outcome, with its response body truncated at the byte budget.
Resolving the port on Quarkus
Quarkus has no config key that always equals the bound port, so the adapter selects quarkus.http.test-port or quarkus.http.port by launch mode. A random =0 port still resolves.
Diagnostic control outcomes
Logger level changes, configuration override removal, Hibernate runtime activation, and SQL, transaction, REST client, and WebSocket capture controls report the backend's accepted outcome, not merely the requested change. A policy refusal shows its specific reason, and unavailable or unchanged capture reports never appear as successful activation. Configuration writes remain Spring-only.
These controls require their documented JSON response. An empty, malformed, or unrecognized reply, or a lost connection, reports an unknown outcome, keeps the last accepted state, and re-reads once without retrying the mutation.
Refresh behavior, Profile resources, Flyway and Liquibase
- A refresh started before an accepted Hibernate activation or capture action cannot overwrite its result. If a refresh is outstanding, one fresh read follows it even with auto-refresh off.
- Profile resources uses the same rule: an older poll cannot replace an accepted start or stop, and an unknown acknowledgement re-reads once without starting or stopping another recording. Empty route rows mean no samples were attributed to listed routes, not that no request ran. At most 20 routes are listed;
routesOmittedcounts the rest. - Flyway and Liquibase require their native action-result JSON before reporting success. A failed action can still have committed earlier migrations, so an HTTP 5xx, lost response, or unknown acknowledgement triggers one history read without retrying. A known 4xx refusal or a cancelled confirmation does not.