Overview
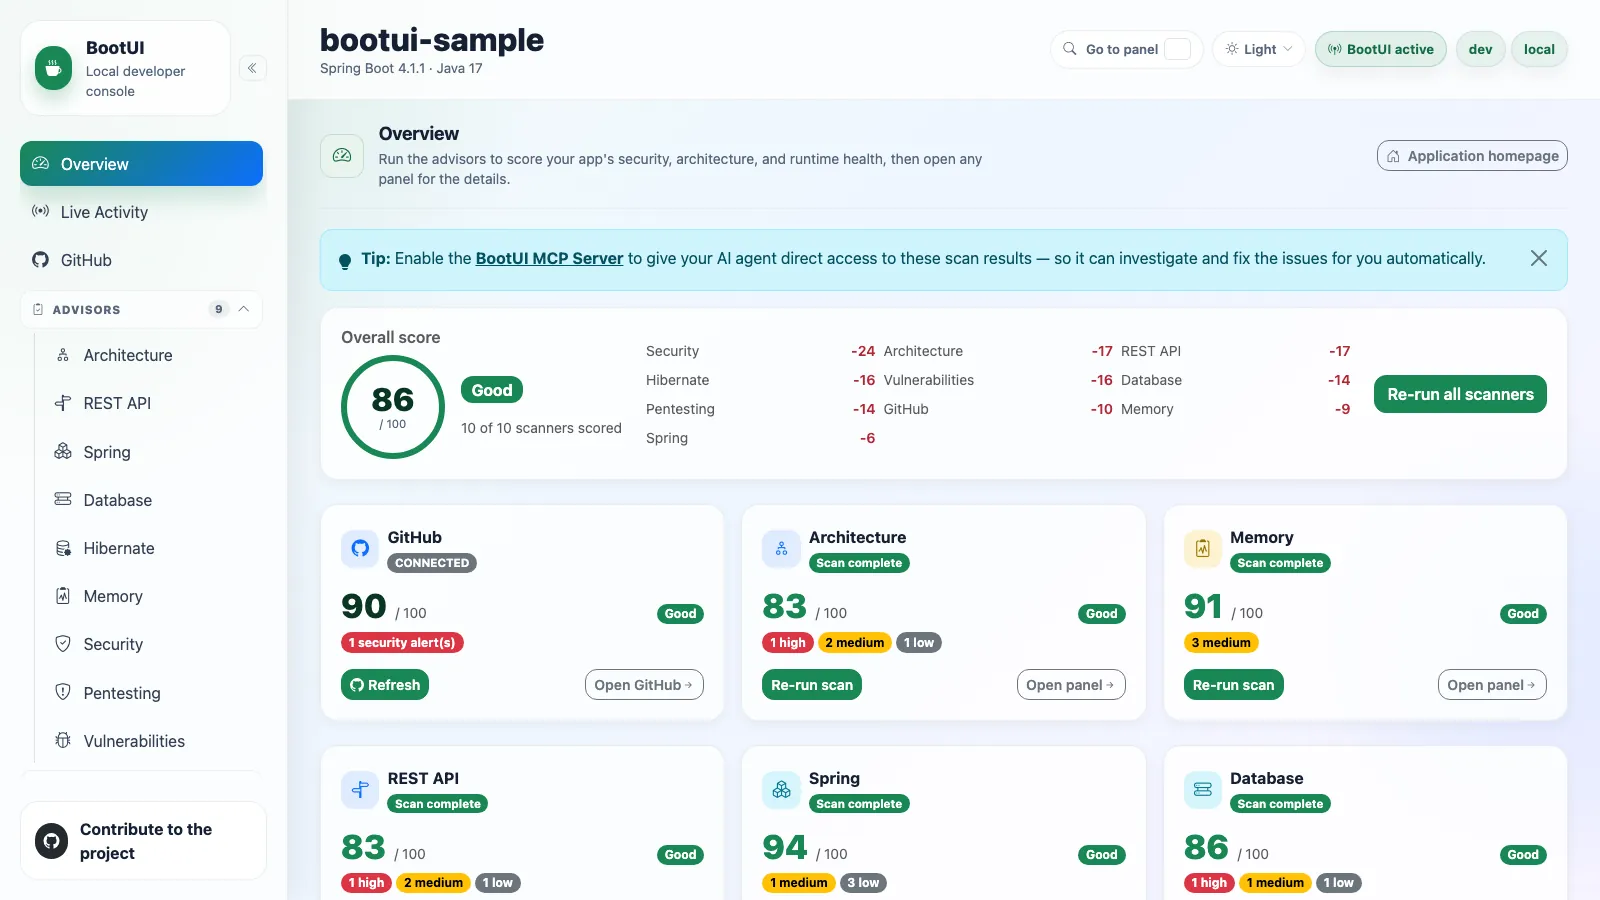
The Overview panel is BootUI's landing page: a guided "understand your app in minutes" dashboard rather than a static summary. It opens with the standard panel header and a link to the running application's homepage.
Its centrepiece is an on-demand security and health scoring dashboard. Nothing is scanned on load. Before any scan has run the overall-score card stays honest — it shows how many scanners have been scored and a prompt to run them, rather than an empty gauge.
Once at least one scanner has scored, an overall score out of 100 summarizes the application's posture with a qualitative band (Good at 80+, Needs attention at 50+, At risk below 50) and a breakdown of what each scanner deducted. Run all scanners triggers every available scanner, or run each card individually. After a run-all, a dismissible tip points to the MCP Server panel, since enabling it lets an AI agent read these same results and fix the findings for you.
Each scanner card shows its own 0–100 score, status, and severity counts. The severity-based scanners are Architecture, Memory, REST API, Spring, Database, Hibernate, Security, Pentesting, and Vulnerabilities. Each starts at 100 and subtracts a fixed weighted penalty per finding — critical 25, high 10, medium 3, low 1 — so a clean scan stays at 100.
GitHub is not a severity scanner. It connects to the local repository and contributes a score derived from open security alerts, but only when the credential is connected and authenticated.
The overall score is the mean of the scanners that actually scored, and only scanners whose panels are available for this application are shown, so the dashboard degrades gracefully when optional infrastructure is missing.
The panel is fully available on every adapter. The scoring dashboard is rendered entirely in the browser: the shell aggregates each advisor's own scan endpoints and computes the same combined score, so no backend dashboard service is involved. The shell chrome around every panel — application name, framework and version, Java version, active profiles, and active/disabled status — comes from the same framework-neutral GET /bootui/api/overview endpoint both adapters expose.
Live Activity
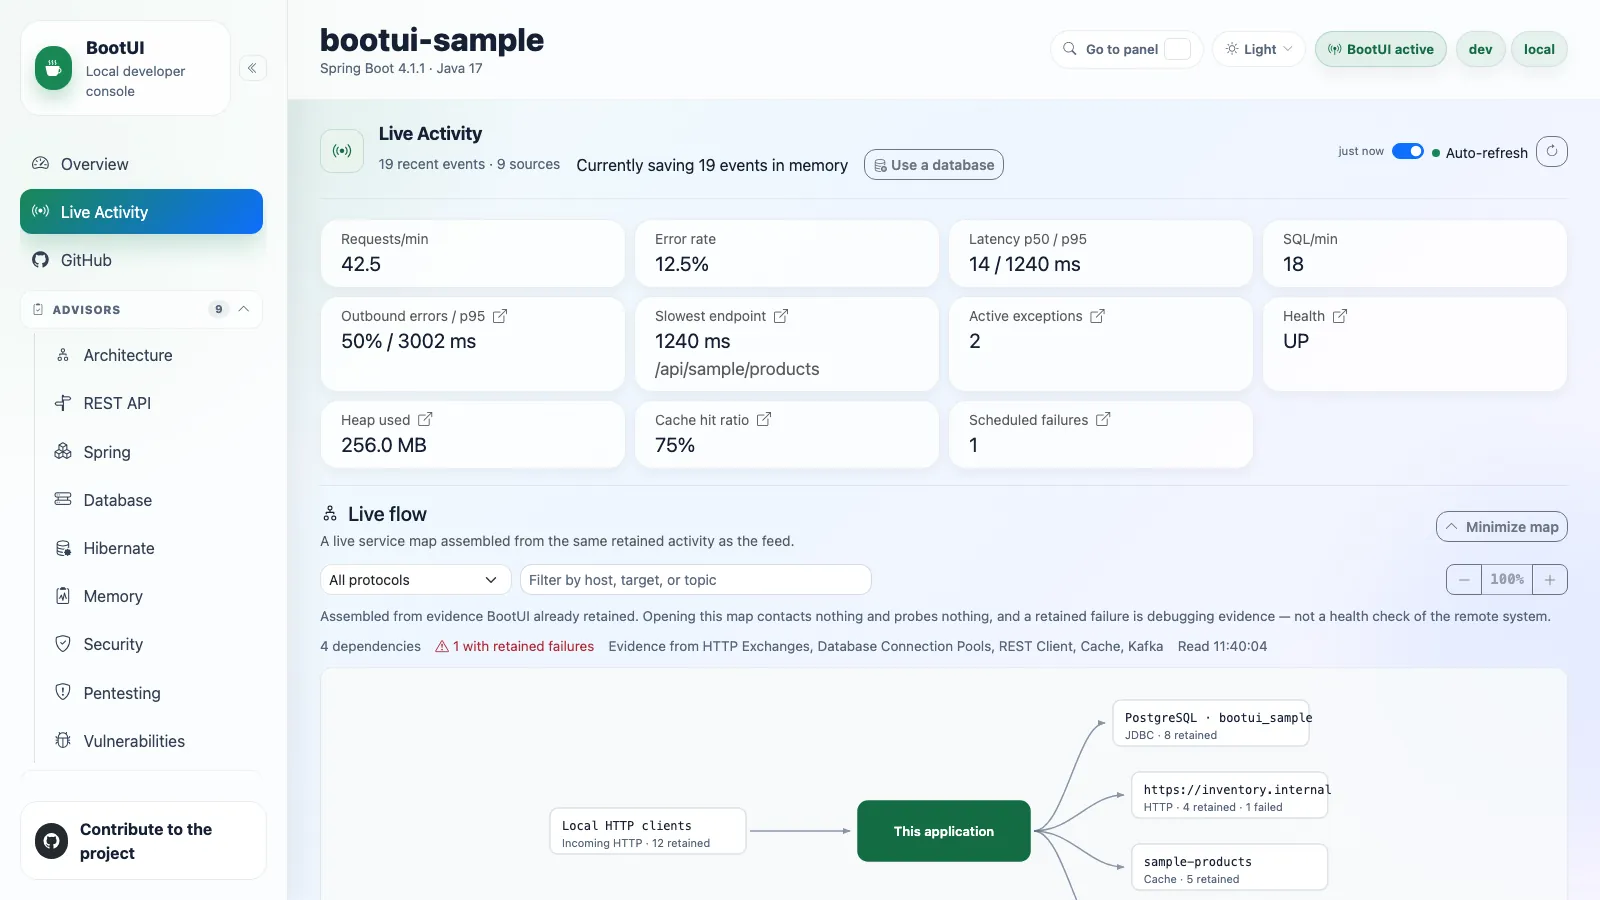
The diagnostics home base: one reverse-chronological stream of everything the application just did, plus a per-request profiler for drilling into any single request.
It adds almost no new instrumentation. Six of its nine signals reuse the same buffers and controllers behind the HTTP Exchanges, SQL Trace, REST Client, Exceptions, Security Logs, and Email panels, so every value is already masked, self-filtered, and bounded exactly as it is there.
The nine signals
| Signal | Type | Captured from | Adapters |
|---|---|---|---|
| Requests | REQUEST | HTTP Exchanges | All |
| SQL | SQL | SQL Trace | All |
| Exceptions | EXCEPTION | Exceptions | All |
| Security | SECURITY | Security Logs | All |
| Emails | MAIL | All | |
| Scheduled | SCHEDULED | Spring's scheduling observability hook; Quarkus's CDI execution events | All |
| Messaging | MESSAGING | Kafka and RabbitMQ everywhere, JMS on Spring only | All |
| REST client | REST_CLIENT | REST Client | Spring MVC, WebFlux, Quarkus |
| Cache | CACHE | A dedicated recorder that stores only a hashed key | Spring MVC, WebFlux |
Scheduled-task capture records each @Scheduled method execution — start, success, failure, duration — without extra proxying on either adapter. Cache rows summarize the operation and cache name (MISS orders), with WARN severity for a miss and OK otherwise; the detail shows only a short hashed key (key a1b2c3…), never a raw key or value, even under full value exposure.
Reading the feed
Each row carries a timestamp, a type icon, a severity (OK, SLOW, WARN, ERROR), a one-line summary, and a duration. Failed rows are highlighted. Slow requests are tinted on a graduated yellow-to-red heat scale crossing 100, 200, 500, and 1000 ms, with a matching latency badge. A request whose correlated SQL looks like an N+1 access pattern carries a red N+1 badge in the row itself, computed with the same threshold and logic the profiler uses, so the two views never disagree.
When the feed is unfiltered, signals BootUI can pin to a request are nested chronologically beneath it and expanded by default, so one click shows exactly what a single request did, in order. Requests that triggered a security event are flagged authenticated with a lock icon and the caller's principal. Signals that cannot be tied to a request stay top-level, and any filter or search flattens the feed so the query spans every signal.
Adjacent identical entries collapse with an occurrence count. The feed filters by type, severity, free text (path, status, SQL, or exception class), and an errors-only toggle; the chosen filters persist across reloads. A requests-over-time sparkline above the table makes spikes and error bursts visible at a glance.
Because the feed is genuinely event-driven, it refreshes over Server-Sent Events rather than fixed-interval polling. The browser subscribes to /bootui/api/activity/stream and re-fetches when any source signals a change. The feed can be paused and resumed so a row you are inspecting does not scroll away.
Every row is a launchpad. Clicking a request row opens its profiler; every row deep-links to its dedicated panel with the originating record pre-filtered. A MAIL row opens that exact message's detail drawer, not just a filtered list.
The KPI strip
Across the top: requests per minute, error rate, p50/p95 latency, SQL rate, the slowest recent endpoint, active exception count, health status, heap usage, and scheduled-task failure count. On Spring servlet and WebFlux only, outbound REST-call error rate and p95 latency, plus the cache hit ratio. All are computed from the same buffers, and sub-millisecond SQL is shown as <1 ms.
Several cards are launchpads: outbound-errors opens REST Client, slowest-endpoint opens HTTP Exchanges pre-filtered to that endpoint, and the active-exceptions, health, heap-usage, cache-hit-ratio, and scheduled-failures cards jump to Exceptions, Health, Heap Dump, Cache, and Scheduled Tasks.
The per-request profiler
Clicking a request opens a Symfony-style drawer that correlates that request's signals. It degrades gracefully and never fabricates data — every correlation is labelled with how it was established.
| Tier | How it matches | Labelled |
|---|---|---|
| Trace id | Micrometer Tracing's traceId, threaded from the MDC | exact |
| Serving thread | The one worker thread that served the request | exact |
| Time window | Method, path, and time window | approximate |
A servlet request runs start-to-finish on one worker thread that serves only one request at a time, so statements on that thread are unambiguously its own. The time-window fallback applies only when the serving thread cannot be uniquely identified — two genuinely concurrent identical requests, or SQL run on an async thread.
Security audit events follow the same rule: matched by time window and principal, but pinned exactly to the serving thread when BootUI captured them there, so two concurrent requests sharing a principal cannot trade security events. An event proven to have fired on another thread is excluded.
Identical repeated SELECTs above bootui.activity.n-plus-one-threshold are flagged as a potential N+1. Each flagged group lists the call sites in your own code that issued it — class, method, and line, captured by bootui.sql-trace.capture-call-site (on by default) — so you know which repository or service method to fix.
The drawer also shows the request's timing breakdown (SQL versus everything else), its auth context, and the trace span list. Escape dismisses it, focus is trapped while it is open, and Copy profile exports the already-masked correlated timeline as plain text to paste into a bug report.
REST client calls, cache accesses, and scheduled-task runs nest correctly in the stream but are not yet part of the profiler's correlated timeline or Copy profile export. The REST Client panel keeps its own "chatty" badge for now.
Messaging capture
Kafka, RabbitMQ, and JMS activity land in the same MESSAGING stream. Payloads are never captured — only metadata — because a message payload is an arbitrary, potentially large and sensitive application object with no generic masking strategy. Raw exception messages are not retained either; failed operations carry only generic failure text. Messaging entries are top-level in the feed today, not nested under a correlated request.
Kafka capture
On Spring, BootUI wraps every application-owned KafkaTemplate with a ProducerListener and every @KafkaListener container factory with a RecordInterceptor — composing with, never replacing, whatever the application already configured. On Quarkus, it hooks SmallRye Reactive Messaging's Kafka interceptors.
Each entry records topic, partition, offset (consumed records only), a hash of the key, direction, success or failure, and — for consumed records — consumer group id, listener identifier, and processing duration. A producer send's duration is not exposed by either framework's callback, so it is not tracked.
The listener identifier is intentionally framework-specific: the listener container factory bean name on Spring, since the per-@KafkaListener id is not exposed at the factory-wide interception point, and the channel name on Quarkus.
Capture is on by default whenever the Kafka integration is present and the panel is enabled. Tune it with bootui.kafka.enabled, bootui.kafka.capture-key, bootui.kafka.max-entries, and bootui.kafka.max-key-length.
JMS capture (Spring MVC and WebFlux only)
Requires spring-jms and jakarta.jms on the classpath. Every JmsTemplate bean is wrapped by a CGLIB proxy that intercepts send/convertAndSend; every AbstractJmsListenerContainerFactory bean is proxied so each container it creates has its listener wrapped by a matching plain or session-aware adapter. Both compose with the application's existing converters, callbacks, and error handlers without replacing them or changing the dispatch interface.
Direct JMSContext, MessageProducer, or MessageConsumer usage is outside this seam, matching how Kafka and RabbitMQ instrument at the framework-integration level.
Each entry records a sanitized destination name — only explicit names and standard Queue/Topic accessors are trusted — plus direction, success or failure, and duration. When a MessageCreator or MessagePostProcessor exposes the provider-assigned JMS message ID, only its one-way hash is retained. Payloads, arbitrary headers and properties, the raw message ID, and exception messages are never captured.
JMS uses its own recorder, bounded buffer, and mapper, so JMS traffic cannot evict Kafka history and either transport can be disabled independently. Tune it with bootui.jms.enabled, bootui.jms.capture-message-id, bootui.jms.max-entries, and bootui.jms.max-message-id-length. No Quarkus JMS equivalent is claimed.
Durable history
By default the stream is in-memory only: history is lost on restart and the feed reaches back only as far as its small buffers. Setting bootui.activity.persistence.enabled=true flushes captured entries to a SQL database over direct JDBC every bootui.activity.persistence.flush-interval (5 seconds by default).
With persistence on, the panel gains a Load older button, the type/severity/free-text filters become real database queries instead of filtering only what is on screen, and a "· persisted history" note appears next to the subtitle.
The backing table (bootui.activity.persistence.table-name, default bootui_activity) is created on first use. Several instances can safely share one table: each tags its rows with an instanceId (defaulting to HOSTNAME) and never reads or prunes another instance's rows. Reads merge the in-memory buffer with the durable store, so recent entries are visible before they are flushed, and a failed flush returns its entries to the buffer rather than losing them.
You do not have to edit configuration or restart to turn this on. While persistence is inactive, a "Currently saving N events in memory" tip appears with a Use a database button. If the application already has a DataSource, a Use the existing datasource action checks it, creates the table, and hot-switches the running instance with no dropped entries and no restart. It is confirmation-gated like every other state-changing action. The switch is runtime-only: nothing is written to disk, so a restart reverts to in-memory unless the property is also set in configuration. With no DataSource present, the button links to the setup documentation instead.
With persistence off, none of this costs anything: no extra bean, thread, or connection is created.
Safety and limits
The panel inherits BootUI's full safety model — loopback filter, Host allow-list, cross-site write defenses, value masking. Its reads are read-only, and its one state-changing action is confirmation-gated and blocked whenever the app or panel is read-only.
The stream is capped by bootui.activity.max-entries and the slow-request threshold is bootui.activity.request-slow-threshold-ms. Individual sources can be turned off through their own bootui.panels.* toggles; a disabled source simply drops out of the stream.
Per-stack behavior
Durable persistence, the "Use the existing datasource" hot-switch, N+1 detection, its row badge, and call-site capture are shared engine code on every adapter. A request that resolves any SQL correlation gets byte-identical N+1 flagging everywhere.
What differs is how signals correlate to a request, because only the servlet model gives a request its own thread:
- Spring MVC uses the full tiered join above: trace id, then serving thread, then time window.
- Spring WebFlux and Quarkus correlate by trace id only. Reactor Netty and the Vert.x event loop have no thread-per-request model, so the thread-based and time-window tiers do not apply. Without a trace id the feed still shows every signal, just flat rather than nested, and the profiler drawer honestly reports itself unavailable rather than fabricating a partial profile.
How each adapter obtains a trace id
Both Spring adapters stamp the server-created trace id onto Actuator's trace-id-less HTTP exchange model through the same bounded HttpExchangeTraceRegistry. MVC reads the SLF4J MDC value its SQL, cache, and REST capture already use; WebFlux reads the active OpenTelemetry span across Reactor hops.
On Quarkus, quarkus-opentelemetry stamps the active server span's trace id at each capture point — the HTTP filter, REST Client recorder, SQL recorder, exception store, and CDI security-event observer. The OpenTelemetry context propagates across the event-loop-to-worker hop, so the same trace id is available for blocking JDBC on a worker thread or a security event from a CDI observer. Trace-id matching is exact, so the profiler reports sqlCorrelationApproximate: false.
Two further Quarkus differences: SQL trace contributes only when a JDBC datasource is configured (the recorder is gated on Agroal), and because the baseline Quarkus feed has no server-side type/severity/since filtering, those filters only take effect once persistence is switched on. Quarkus's own security layer authenticating the caller takes precedence over a correlated audit event when both are known.
For per-panel detail see Framework support.
Live flow (service map)
A compact service map sits between the KPI summary and the feed controls, served by GET /bootui/api/activity/service-map on every adapter. Where the feed answers "what just happened, in order?", the map answers "what does this application actually talk to?" — the application at the centre, a generic Local HTTP clients lane feeding in, and one node per outbound dependency.
Nothing is instrumented and nothing is contacted. Opening the map performs no network call, probe, DNS lookup, connection attempt, or scan. It is assembled entirely from buffers other panels already fill: inbound requests, outbound HTTP calls grouped to a scheme://host[:port] origin, configured JDBC pools, retained SQL statements, cache accesses, Kafka producer topics, and RabbitMQ publisher destinations. Consumed Kafka records and consumed AMQP messages are inbound work, so they are deliberately never drawn as outbound dependencies.
The map separates what is configured from what has been observed and never collapses the two. A declared datasource with no traffic is drawn with a dashed outline reading "configured, no recent evidence" rather than disappearing. Selecting any node opens an evidence panel with retained interaction and failure counts, when it was last seen, an explicit note about what that node does and does not prove, a tail of recent interactions, and a deep link into the source panel. A retained failure is debugging evidence, never a health check of the remote system — BootUI has not contacted it.
Statement evidence is attributed to a pool only when attribution is unambiguous: exactly one configured pool and exactly one traced datasource whose name matches it. Otherwise statements are summarized on their own SQL statements node, the pools stay configured-only, and the reason is stated as a warning.
Identity is deliberately subtractive. An HTTP dependency is only ever an origin — user-info credentials, paths, query strings, and fragments are dropped before serialization, and a call that cannot be reduced to a safe origin is left off the map with a visible warning rather than shown under a guessed identity. JDBC targets independently lose authority and Oracle credentials plus any driver parameter tail, even under full value exposure. SQL text, bound parameters, message keys, payloads, and headers never reach this contract at all. Cardinality is capped at 28 dependencies before rendering; anything withheld is reported as a visible count, never dropped silently.
Cache is a first-class dependency on Spring MVC and WebFlux whenever at least one CacheManager was successfully instrumented, grouped by cache manager and cache name — never the key or value. An enabled recorder without an instrumented manager does not advertise a source that cannot receive evidence. Quarkus honestly reports no cache dependency at all: quarkus-cache's built-in interceptors leave no comparable seam, the same reason its feed has no CACHE entries.
Motion, layout, and accessibility
Motion is evidence, not decoration. The map refreshes off the same Server-Sent Events tick as the feed and animates a particle only when a stable edge — present both before and after the refresh — carries an interaction id the previous snapshot did not. A first load animates nothing, a new dependency simply appears, and an idle application is completely still. Bursts are coalesced to a small per-edge count and a hard concurrent cap rather than queued, so motion can never lag behind reality.
When freshly animated interactions share a non-null opaque flow id, the inbound pulse starts immediately and downstream pulses replay only after it would have arrived, in retained completion-time order with a bounded stagger. A downstream pulse whose batch carries no retained inbound item fires immediately rather than waiting for evidence that may already have scrolled out of the tail. Sequencing changes only pacing, never the evidence itself.
Slow interactions pulse a calm amber for longer than normal completions or failures, with a restrained trailing halo, so timing carries meaning without relying on color alone. A temporary target ring and text chip (SLOW · 1.3 s or ERROR) appears only for the pulse's scheduled window. Retained failures stay visible in counts, details, and accessible text, but never leave nodes or edges permanently red.
The spatial model is hybrid and deterministic: inbound lane left, application hub centre, and an airy right-facing fan for up to six dependencies before denser maps switch to a two-column rack. The fan uses a 288-pixel radius and 72-pixel vertical pitch, keeping typical maps around 800–844 logical pixels wide. The rack uses a 72-pixel application gap, 32-pixel column gap, and 72-pixel row pitch, bounded at 1,040 by 1,046 pixels at the 28-dependency cap inside the scrollable stage. Fan connectors and collision-free rack routes are reused exactly by each pulse and slow trail through CSS Motion Path, so dynamically inserted evidence starts on its own mount-relative delay instead of the SVG document timeline.
The map is keyboard navigable (arrows move between nodes, Enter or Space selects), carries a hidden textual list of every node and relationship for screen readers, and supports protocol and free-text filters plus zoom. Under prefers-reduced-motion, particles are replaced by a brief static highlight plus a polite live-region sentence naming what changed and its duration. Evidence from a disabled or unavailable source panel never reaches the map.
Developers who want a denser event-first view can minimize the map; that preference is remembered in the browser while the feed stays visible underneath. The viewport adapts to the graph's content, up to a bounded scrolling height.
GitHub
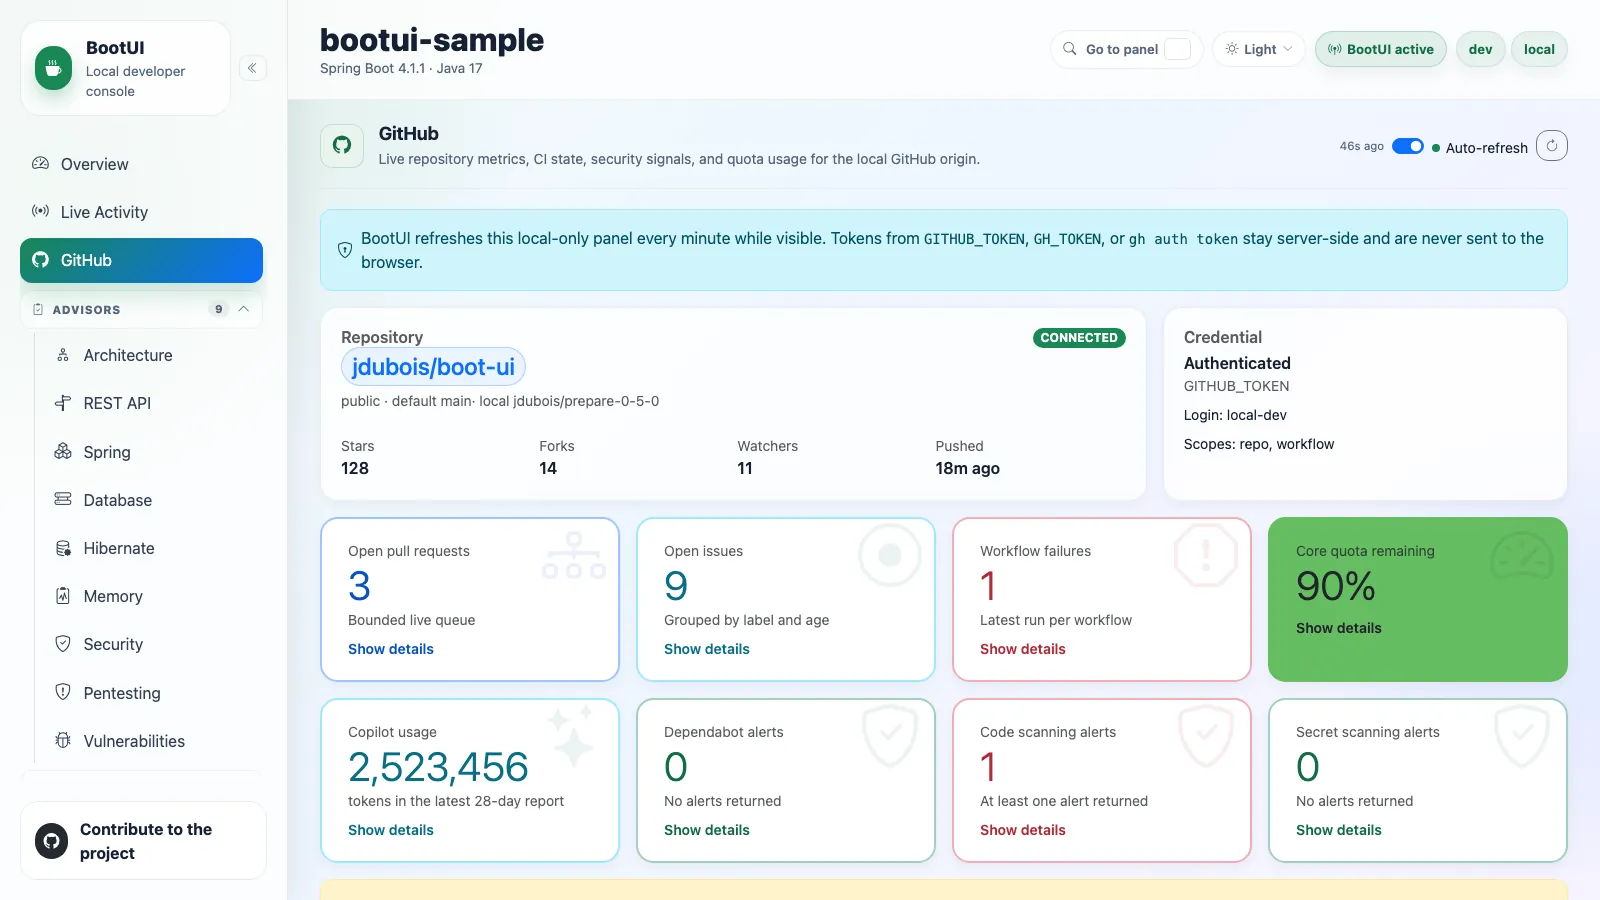
Summarizes the current project's GitHub state, read from the local origin remote. It auto-refreshes on BootUI's standard one-minute interval while the tab is visible; the initial refresh and each interval are bounded and blocked by the panel's read-only settings.
No network call happens on render. GET /bootui/api/github never contacts GitHub — only the explicit POST /bootui/api/github/refresh action does, gated by bootui.github.api-enabled and the host allow-list.
The panel shows repository metadata and an eight-card summary grid, each card opening a detail drawer:
- Open pull requests and open issues — the issues drawer summarizes label and staleness buckets, then lists the bounded set of open issues with author, labels, comment count, and last-updated time. Pull requests returned by the issues endpoint are excluded.
- GitHub Actions — rows link to the matching run and show workflow, branch, event, status, and duration. The failure count considers only the latest execution per workflow and branch, so older failures drop out once a later run fixes that workflow on that branch.
- Quotas — the card shows the lowest remaining percentage on a red-to-green palette. The drawer is hidden by default, renders every resource from GitHub's
/rate_limitresponse dynamically, and highlights anything at or below 10% remaining. Best-effort cards for Actions cache, artifacts, and Actions billing appear when the credential can reach those endpoints. - Copilot usage — the report window and link count only, from GitHub's organization report metadata endpoint. Signed report URLs are never downloaded or exposed.
- Three security signals — drawers link to the matching alert pages. Dependabot additionally lists open alerts with package, ecosystem, severity, advisory ID, summary, affected range, and fixed version, capped by
bootui.github.max-security-alerts. Code scanning and secret scanning stay count-only and never inline secret values or vulnerable code snippets.
Credentials are read from the current device only: GITHUB_TOKEN, GH_TOKEN, or an existing gh auth token login. The token is never sent to the browser, persisted by BootUI, or included in warnings. Without a token, public repositories use GitHub's unauthenticated rate limits. Refreshes are bounded by per-request timeouts, a maximum API-call budget, and a quota safety threshold that skips optional sections before exhausting the core API quota.
The panel is identical on Quarkus, over the same engine and the same /bootui/api/github contract. The only difference is internal: Quarkus supplies a Jackson 2 client implementation where Spring Boot 4 uses Jackson 3.