Features
Coffilot turns a Maven- or Gradle-based Java / Spring Boot / Quarkus project into an interactive console in the Copilot app's side panel. The build tool is auto-detected per project: Maven (pom.xml / ./mvnw) is used when present; otherwise Gradle (build.gradle[.kts] / ./gradlew). When both are present Maven wins; when neither is found the console says so and stays disabled until one is added.
Build, test and package lanes
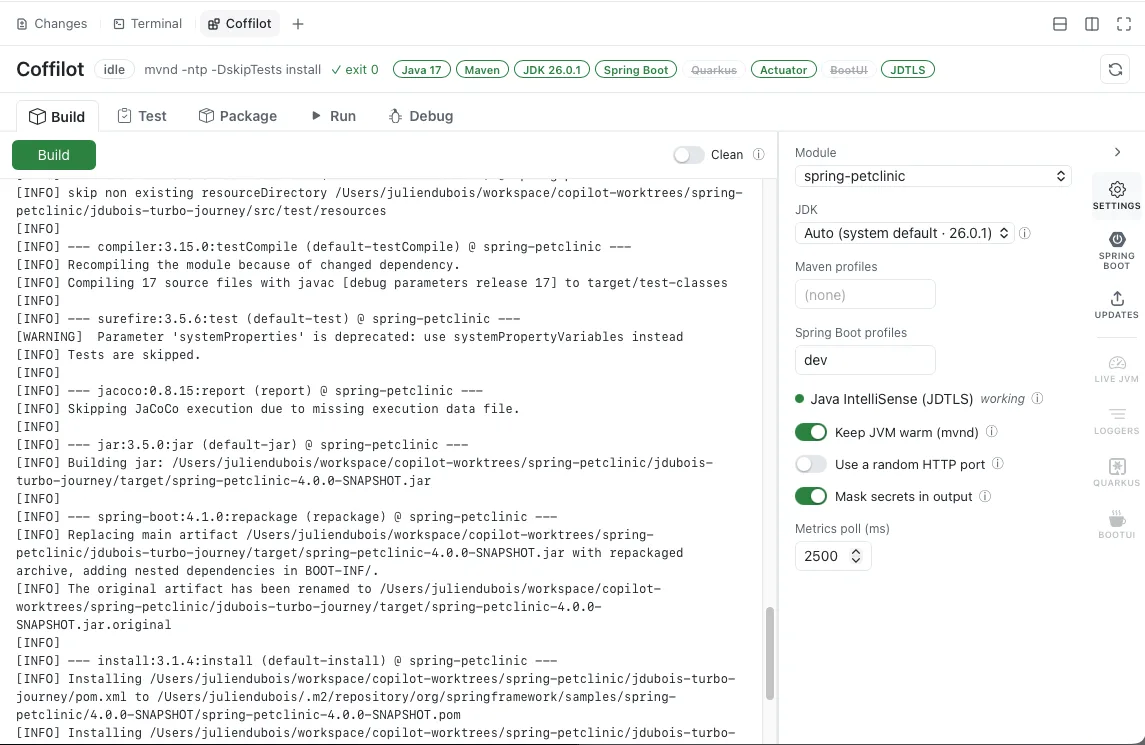
- Build — Maven
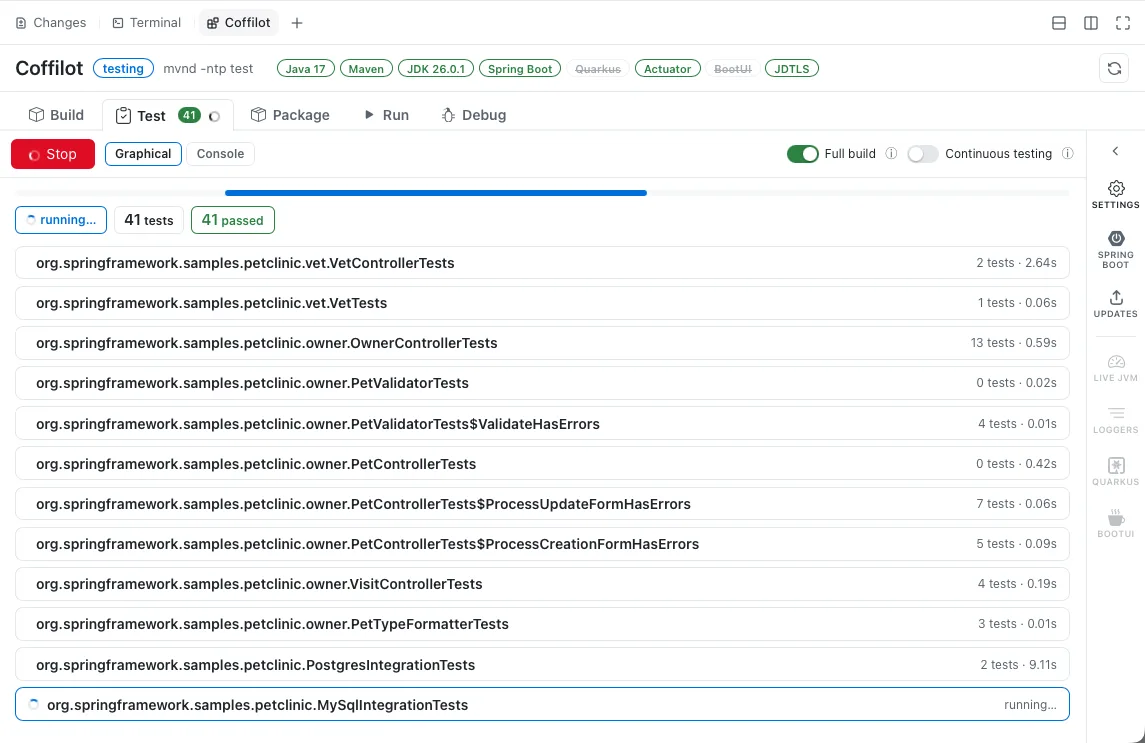
./mvnw -ntp -DskipTests installor Gradle./gradlew build -x test(args overridable). A Clean toggle (off by default) runs a clean first. - Test — Maven
./mvnw -ntp testor Gradle./gradlew cleanTest test, with the JUnit results parsed into a graphical, per-test view (summary chips, per-suite grouping, expandable failure stack traces) and a live progress bar. A console toggle shows the raw output. - Run affected — runs only the tests relevant to your uncommitted changes (git working tree vs
HEAD) instead of the whole suite. Coffilot builds a dependency graph from the compiled.classfiles (reading each class's constant pool, no extra dependencies) and runs just the test classes that transitively depend on the changed code — via Surefire-Dtest=…(Maven) or--tests …(Gradle). Build once for dependency-accurate selection; before the first compile it falls back to a name-based mapping (Foo→FooTest/FooTests/FooIT). - Package — Maven
./mvnw -ntp packageor Gradle./gradlew assemble, streamed live like Build. A Clean toggle runs a clean first, and an Install toggle installs the artifact to the local repository instead of just packaging. - Parallel lanes — Build / Test / Package share one build lane while Run is independent, so you can keep the app running while you re-test.
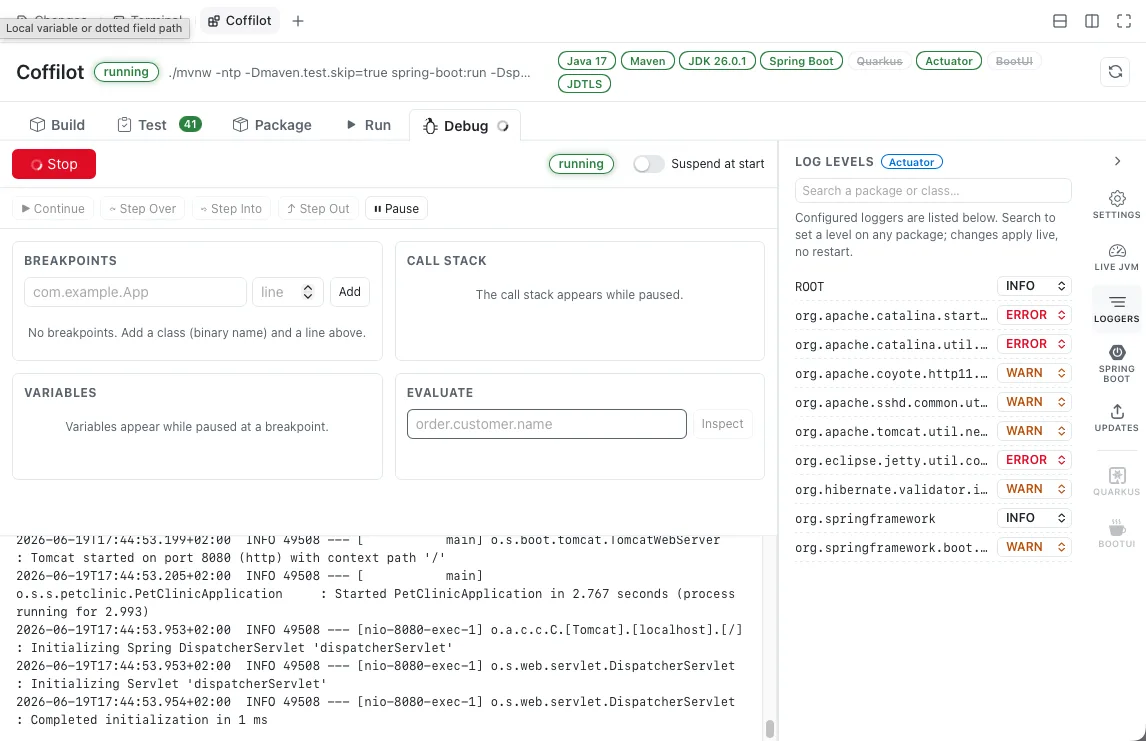
Run and debug
- Run —
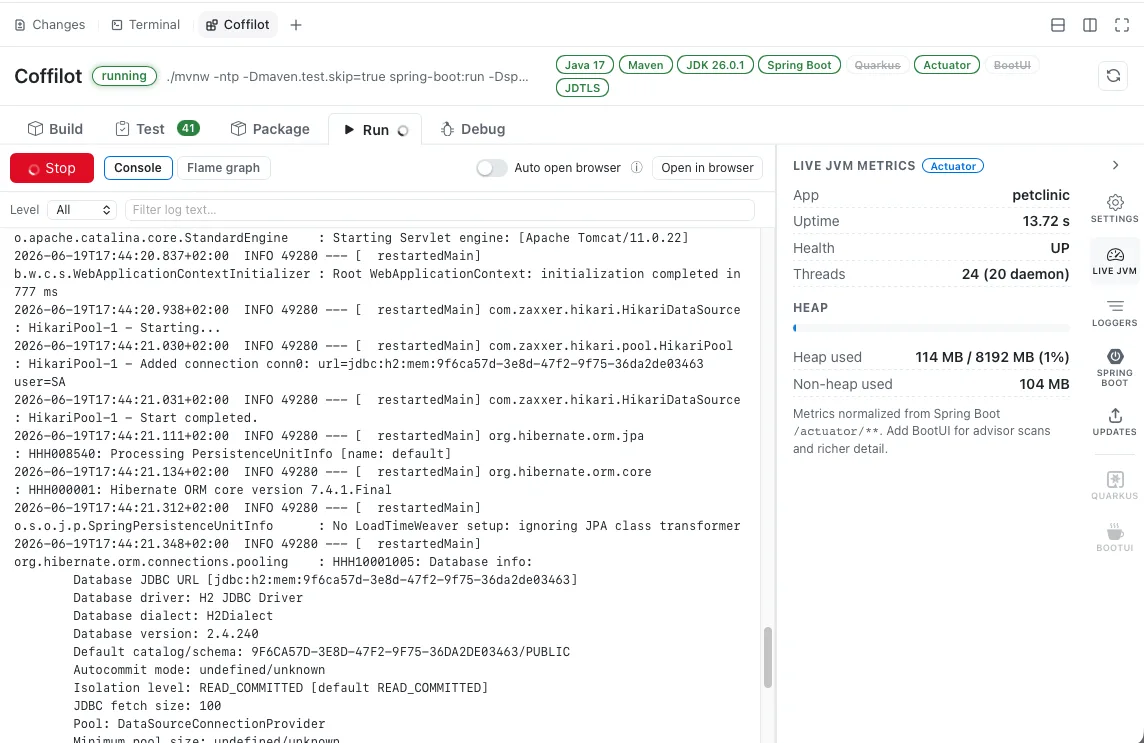
spring-boot:run(Maven) /bootRun(Gradle) for a Spring Boot module (+ Spring profiles),quarkus:dev(Maven) /quarkusDev(Gradle) for a Quarkus module (+ run profile), or, for a non-Spring/non-Quarkus module, the generic runner: the Gradleapplicationplugin'sruntask, else build +java -jarfor an executable jar, else the configured main class viajava -cp. Optionally opens a browser window at the app once it is up. - Debug — launches the app exactly like Run but with the JDWP agent enabled (
-agentlib:jdwp=…server=y,address=127.0.0.1:<port>, loopback only) and a self-contained JDWP debugger attached — no external DAP server or language server required. The Debug tab drives breakpoints, continue, step in/over/out, pause, the paused call stack, frame-local variables and a dotted-path evaluator. Debug and Run are mutually exclusive (they share the single app slot), and Copilot can drive the whole session through agent actions. - Stop — terminates the running app / build process.
- Profiles — the toolbar scans the project for available run profiles — Spring Boot profiles (
application-<profile>.*) or Quarkus profiles — and, for Maven, the reactor's Maven profiles, offering each as an editable dropdown.
Live observability
- Live JVM metrics — once the app is up, the panel shows heap / non-heap, threads, health, profiles and startup info, sourced from the richest endpoint available (BootUI → Actuator → Quarkus Micrometer/health → process).
- Live logs & log levels — the Run console doubles as a log viewer with a minimum-severity filter and text search. A Loggers side tab lists the running app's loggers from Spring Boot Actuator
/loggersor the Quarkusquarkus-logging-managerextension and lets you change any level live — no restart. - Flame graph (async-profiler or JFR) — records an on-demand CPU / allocation / wall-clock / lock-contention profile of the running app's JVM and renders an interactive flame graph plus a Top hotspots list. Uses async-profiler (
asprof) when installed, falling back to the JDK-bundled JDK Flight Recorder (viajcmd). An Analyze hotspots with Copilot button sends the hottest methods to the agent.
Fix with Copilot
On a compile error, failing tests, a startup crash, a Quarkus dev-mode build/augmentation failure (where the process stays up waiting for a fix), or a running app that exposes no runtime-logger endpoint, a Fix with Copilot button pushes a context-rich request back into the chat so the agent can diagnose and fix it.
Advisor scans, MCP bridges and upgrades
- Advisor scans (with BootUI) — when the running app exposes BootUI, the BootUI tab lists its advisor scans (architecture, Spring, security, Hibernate, …) and runs them directly over BootUI's REST API; findings can be sent to the agent with one click. A separate Register with Copilot button can enable BootUI's in-app MCP server and wire it into the Copilot CLI config.
- Quarkus Agent MCP (for Quarkus projects) — a dedicated Quarkus tab offers a Register with Copilot button that wires the standalone Quarkus Agent MCP server into the Copilot CLI config (via JBang, or
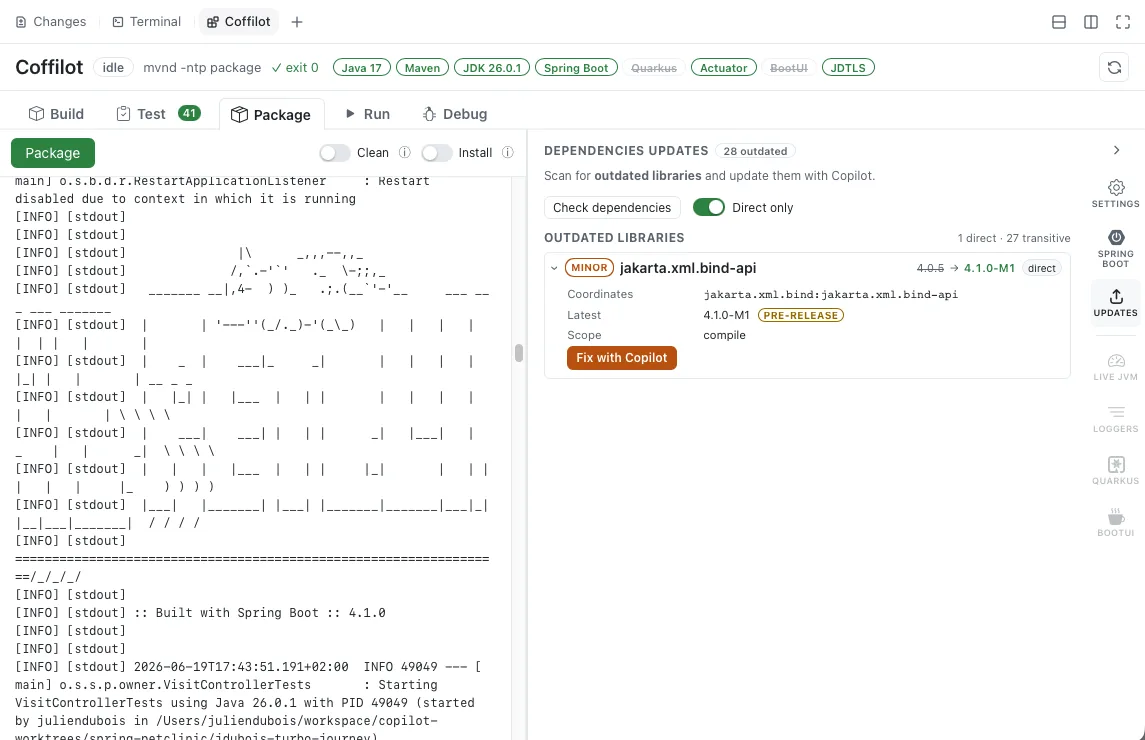
java -jaras a fallback), giving the agent Quarkus-native tooling. - Upgrades — an Upgrades side tab that doesn't need the app running. For Maven and Gradle projects it lists outdated libraries — each shown with its current → latest version, an upgrade-size badge (major / minor / patch), pre-release warnings, and a direct/transitive marker. Each finding carries a Fix with Copilot button.
Workflow conveniences
- Refresh — re-runs the project discovery done at launch (build tool, modules, profiles and detected technologies) without reloading the extension.
- Keep the JVM warm — optionally use the Maven Daemon (
mvnd) or the always-on Gradle daemon for Build / Test / Package so repeat runs skip JVM startup and JIT warmup. - Switch JDK — a JDK selector in Settings runs every action under the JDK you pick. JDKs are auto-discovered (primarily from SDKMAN, then OS-standard install locations and your
JAVA_HOME) and applied by injectingJAVA_HOME. - Spring Boot tab — for Spring Boot projects, a dedicated tab reports the project's Spring Boot version, maps its release line to a support status from an embedded endoflife.date table, and hosts DevTools controls.
- Responsive layout — on a wide canvas the Live JVM / Loggers / Upgrades / Settings panel is docked on the right; as the canvas narrows it collapses to an icon rail that slides panes out as overlays.
Graceful degradation by capability
The console adapts to whatever the project provides, detected from the build files (static) and confirmed against the running app (runtime):
| Tier | Detected from | What the console offers |
|---|---|---|
| (none) | no Maven or Gradle markers | A "needs Maven or Gradle" notice; lanes stay disabled |
| Java (base) | pom.xml / mvnw or build.gradle / gradlew | Build, Test (graphical JUnit report), Package |
| Spring Boot | Spring Boot Maven/Gradle plugin | Run via spring-boot:run / bootRun + editable Spring profiles |
| Quarkus | Quarkus Maven plugin / io.quarkus Gradle plugin | Run via quarkus:dev / quarkusDev (dev mode + live reload) + editable Quarkus profile |
| Actuator (runtime) | /actuator/* or /management/* answers | Live metrics from Actuator + runtime log-level control via /loggers |
| Quarkus metrics (runtime) | /q/metrics / /q/health answer | Live metrics from Quarkus Micrometer + SmallRye Health + quarkus-logging-manager control |
| BootUI (runtime) | /bootui/api/* answers | Rich BootUI metrics and the REST advisor-scan panel |
| Quarkus Agent MCP | Quarkus module + JBang or Java 21+ | A Quarkus tab wiring the external Quarkus Agent MCP server into the CLI |
A capability summary is shown in the status bar (including the active build tool), and the metrics panel carries a small badge (BootUI / Actuator / Quarkus / process) indicating which source is live.